McDonalds 2014 Annual Report Download - page 46
Download and view the complete annual report
Please find page 46 of the 2014 McDonalds annual report below. You can navigate through the pages in the report by either clicking on the pages listed below, or by using the keyword search tool below to find specific information within the annual report.-
 1
1 -
2
-
3
-
4
-
5
-
6
-
7
-
8
-
9
-
10
-
11
-
12
-
13
-
14
-
15
-
16
-
17
-
18
-
19
-
20
-
21
-
22
-
23
-
24
-
25
-
26
-
27
-
28
-
29
-
30
-
31
-
32
-
33
-
34
-
35
-
 36
36 -
 37
37 -
 38
38 -
 39
39 -
 40
40 -
 41
41 -
 42
42 -
 43
43 -
 44
44 -
 45
45 -
 46
46 -
 47
47 -
 48
48 -
 49
49 -
 50
50 -
 51
51 -
 52
52 -
 53
53 -
 54
54 -
 55
55 -
 56
56 -
57
-
58
-
59
-
60
-
61
-
62
-
63
-
64
 |
 |

40 McDonald’s Corporation 2014 Annual Report
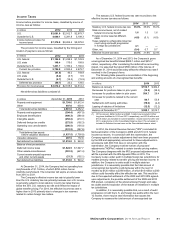
Franchise Arrangements
Conventional franchise arrangements generally include a lease
and a license and provide for payment of initial fees, as well as
continuing rent and royalties to the Company based upon a
percent of sales with minimum rent payments that parallel the
Company’s underlying leases and escalations (on properties that
are leased). Under this arrangement, franchisees are granted the
right to operate a restaurant using the McDonald’s System and, in
most cases, the use of a restaurant facility, generally for a period
of 20 years. These franchisees pay related occupancy costs
including property taxes, insurance and maintenance. Affiliates
and developmental licensees operating under license agreements
pay a royalty to the Company based upon a percent of sales, and
may pay initial fees.
Revenues from franchised restaurants consisted of:
In millions 2014 2013 2012
Rents $6,106.7 $6,054.4 $5,863.5
Royalties 3,085.1 3,100.4 3,032.6
Initial fees 80.2 76.7 68.4
Revenues from franchised
restaurants $9,272.0 $9,231.5 $8,964.5
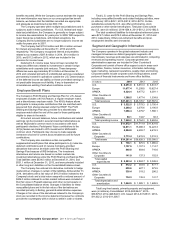
Future gross minimum rent payments due to the Company
under existing franchise arrangements are:
In millions Owned sites Leased sites Total
2015 $ 1,298.3 $ 1,353.7 $ 2,652.0
2016 1,258.0 1,309.8 2,567.8
2017 1,205.3 1,256.1 2,461.4
2018 1,164.5 1,188.8 2,353.3
2019 1,127.1 1,127.2 2,254.3
Thereafter 9,670.7 8,442.8 18,113.5
Total minimum payments $15,723.9 $14,678.4 $30,402.3
At December 31, 2014, net property and equipment under
franchise arrangements totaled $15.2 billion (including land of $4.4
billion) after deducting accumulated depreciation and amortization
of $8.2 billion.
Leasing Arrangements
At December 31, 2014, the Company was the lessee at 15,059
restaurant locations through ground leases (the Company leases
the land and the Company or franchisee owns the building) and
through improved leases (the Company leases land and
buildings). Lease terms for most restaurants, where market
conditions allow, are generally for 20 years and, in many cases,
provide for rent escalations and renewal options, with certain
leases providing purchase options. Escalation terms vary by
market with examples including fixed-rent escalations, escalations
based on an inflation index, and fair-value market adjustments.
The timing of these escalations generally ranges from annually to
every five years. For most locations, the Company is obligated for
the related occupancy costs including property taxes, insurance
and maintenance; however, for franchised sites, the Company
requires the franchisees to pay these costs. In addition, the
Company is the lessee under non-cancelable leases covering
certain offices and vehicles.
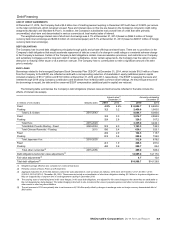
The following table provides detail of rent expense:
In millions 2014 2013 2012
Company-operated
restaurants:
U.S. $ 61.3 $ 61.6 $ 59.1
Outside the U.S. 708.3 713.4 661.0
Total 769.6 775.0 720.1
Franchised restaurants:
U.S. 446.3 441.6 433.0
Outside the U.S. 610.1 572.0 519.7
Total 1,056.4 1,013.6 952.7
Other 106.3 104.0 104.2
Total rent expense $ 1,932.3 $ 1,892.6 $ 1,777.0
Rent expense included percent rents in excess of minimum
rents (in millions) as follows–Company-operated restaurants:
2014–$164.2; 2013–$175.6; 2012–$169.6. Franchised
restaurants: 2014–$182.8; 2013–$187.4; 2012–$178.7.
Future minimum payments required under existing operating
leases with initial terms of one year or more are:
In millions Restaurant Other Total
2015 $ 1,305.3 $ 76.5 $ 1,381.8
2016 1,222.2 66.7 1,288.9
2017 1,107.8 55.4 1,163.2
2018 995.4 48.7 1,044.1
2019 905.3 41.4 946.7
Thereafter 7,178.7 156.8 7,335.5
Total minimum payments $12,714.7 $ 445.5 $13,160.2