McDonalds 2014 Annual Report Download - page 24
Download and view the complete annual report
Please find page 24 of the 2014 McDonalds annual report below. You can navigate through the pages in the report by either clicking on the pages listed below, or by using the keyword search tool below to find specific information within the annual report.-
 1
1 -
2
-
3
-
4
-
5
-
6
-
7
-
8
-
9
-
10
-
11
-
12
-
13
-
 14
14 -
 15
15 -
 16
16 -
 17
17 -
 18
18 -
 19
19 -
 20
20 -
 21
21 -
 22
22 -
 23
23 -
 24
24 -
 25
25 -
 26
26 -
 27
27 -
 28
28 -
 29
29 -
 30
30 -
 31
31 -
 32
32 -
 33
33 -
 34
34 -
35
-
36
-
37
-
38
-
39
-
40
-
41
-
42
-
43
-
44
-
45
-
46
-
47
-
48
-
49
-
50
-
51
-
52
-
53
-
54
-
55
-
56
-
57
-
58
-
59
-
60
-
61
-
62
-
63
-
64
 |
 |

18 McDonald’s Corporation 2014 Annual Report
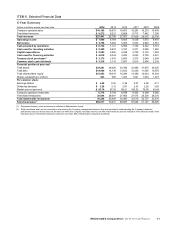
In 2013, net income increased 2% (3% in constant
currencies) to $5.6 billion and diluted earnings per common share
increased 4% (4% in constant currencies) to $5.55. Foreign
currency translation had a negative impact of $0.05 on diluted
earnings per share. Net income and diluted earnings per share
growth in constant currencies were positively impacted by higher
franchised margin dollars, and to a lesser extent, lower selling,
general and administrative expenses. This was partly offset by
lower Company-operated margin dollars.
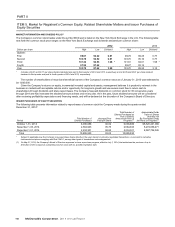
The Company repurchased 33.1 million shares of its stock for
$3.2 billion in 2014 and 18.7 million shares of its stock for $1.8
billion in 2013, driving reductions in weighted-average shares
outstanding on a diluted basis in both periods, which positively
benefited earnings per share.
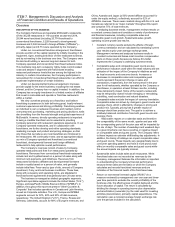
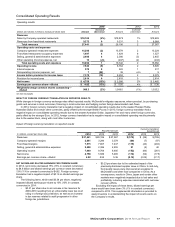
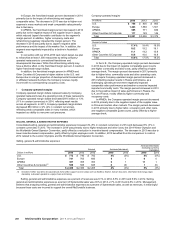
REVENUES
The Company’s revenues consist of sales by Company-operated restaurants and fees from restaurants operated by franchisees. Revenues
from conventional franchised restaurants include rent and royalties based on a percent of sales, minimum rent payments and initial fees.
Revenues from franchised restaurants that are licensed to foreign affiliates and developmental licensees include a royalty based on a
percent of sales, and generally include initial fees.
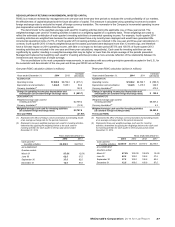
In 2014, constant currency revenue was flat compared to the prior year, reflecting the impact of negative comparable sales, partially
offset by expansion. In 2013, constant currency revenue growth was due to expansion. Weak comparable sales reflected a muted response
to customer-facing initiatives amid a highly competitive and sluggish IEO segment across many markets.
Revenues
Amount Increase/(decrease)
Increase/(decrease)
excluding currency
translation
Dollars in millions 2014 2013 2012 2014 2013 2014 2013
Company-operated sales:
U.S. $ 4,351 $ 4,512 $ 4,530 (4%) 0% (4%) 0%
Europe 7,808 8,138 7,850 (4) 403
APMEA 5,270 5,425 5,350 (3) 1(2) 2
Other Countries & Corporate 740 800 873 (7) (8) (1) (6)
Total $18,169 $18,875 $18,603 (4%) 1% (1%) 1%
Franchised revenues:
U.S. $ 4,300 $ 4,339 $ 4,284 (1%) 1% (1%) 1%
Europe 3,270 3,162 2,977 3634
APMEA 1,054 1,052 1,041 0158
Other Countries & Corporate 648 678 662 (4) 298
Total $ 9,272 $ 9,231 $ 8,964 0% 3% 2% 3%
Total revenues:
U.S. $ 8,651 $ 8,851 $ 8,814 (2%) 0% (2%) 0%
Europe 11,078 11,300 10,827 (2) 413
APMEA 6,324 6,477 6,391 (2) 1(1) 3
Other Countries & Corporate 1,388 1,478 1,535 (6) (4) 40
Total $27,441 $28,106 $27,567 (2%) 2% 0% 2%
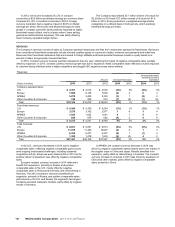
In the U.S., revenues decreased in 2014 due to negative
comparable sales, reflecting negative comparable guest counts
amid ongoing broad-based challenges, including sustained
competitive activity. Revenues were relatively flat in 2013 as the
positive impact of expansion was offset by negative comparable
sales.
Europe's constant currency increase in 2014 reflected a
benefit from expansion, primarily in Russia, and positive
comparable sales in the U.K, mostly offset by negative
comparable sales in Russia and Germany, and refranchising in
Germany. The 2013 increase in revenues benefited from
expansion, primarily in Russia, and positive comparable sales
performance in the U.K. and Russia, the segment's two largest
Company-operated restaurant markets, partly offset by negative
results in Germany.
In APMEA, the constant currency decrease in 2014 was
driven by negative comparable sales primarily due to the impact of
the supplier issue in China and Japan. Results benefited from
expansion, partly offset by refranchising in Australia. The constant
currency increase in revenues in 2013 was driven by expansion in
China and other markets, partly offset by negative comparable
sales, primarily in China.