McDonalds 2014 Annual Report Download - page 48
Download and view the complete annual report
Please find page 48 of the 2014 McDonalds annual report below. You can navigate through the pages in the report by either clicking on the pages listed below, or by using the keyword search tool below to find specific information within the annual report.-
 1
1 -
2
-
3
-
4
-
5
-
6
-
7
-
8
-
9
-
10
-
11
-
12
-
13
-
14
-
15
-
16
-
17
-
18
-
19
-
20
-
21
-
22
-
23
-
24
-
25
-
26
-
27
-
28
-
29
-
30
-
31
-
32
-
33
-
34
-
35
-
36
-
37
-
 38
38 -
 39
39 -
 40
40 -
 41
41 -
 42
42 -
 43
43 -
 44
44 -
 45
45 -
 46
46 -
 47
47 -
 48
48 -
 49
49 -
 50
50 -
 51
51 -
 52
52 -
 53
53 -
 54
54 -
 55
55 -
 56
56 -
 57
57 -
 58
58 -
59
-
60
-
61
-
62
-
63
-
64
 |
 |

42 McDonald’s Corporation 2014 Annual Report
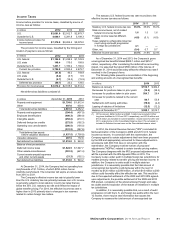
benefits recorded. While the Company cannot estimate the impact
that new information may have on our unrecognized tax benefit
balance, we believe that the liabilities recorded are appropriate
and adequate as determined under ASC 740.
The Company operates within multiple tax jurisdictions and is
subject to audit in these jurisdictions. For U.S. federal and major
state tax jurisdictions, the Company is generally no longer subject
to income tax examinations for years prior to 2009. With respect to
major foreign tax jurisdictions, with limited exceptions, the
Company and its subsidiaries are no longer subject to income tax
audits for years prior to 2007.
The Company had $119.0 million and $55.4 million accrued
for interest and penalties at December 31, 2014 and 2013,
respectively. The Company recognized interest and penalties
related to tax matters of $87.9 million in 2014, $14.4 million in
2013, and $11.2 million in 2012, which are included in the
provision for income taxes.
Deferred U.S. income taxes have not been recorded for
temporary differences related to investments in certain foreign
subsidiaries and corporate joint ventures. These temporary
differences were approximately $15.4 billion at December 31,
2014 and consisted primarily of undistributed earnings considered
permanently invested in operations outside the U.S. Determination
of the deferred income tax liability on these unremitted earnings is
not practicable because such liability, if any, is dependent on
circumstances existing if and when remittance occurs.
Employee Benefit Plans
The Company’s Profit Sharing and Savings Plan for U.S.-based
employees includes a 401(k) feature, a regular employer match,
and a discretionary employer match. The 401(k) feature allows
participants to make pretax contributions that are matched each
pay period from shares released under the ESOP. The Profit
Sharing and Savings Plan also provides for a discretionary
employer match after the end of the year for those participants
eligible to share in the match.
All current account balances, future contributions and related
earnings can be invested in several investment alternatives as
well as McDonald’s common stock in accordance with each
participant’s elections. Participants’ future contributions to the
401(k) feature are limited to 20% investment in McDonald’s
common stock. Participants may choose to make separate
investment choices for current account balances and for future
contributions.
The Company also maintains certain nonqualified
supplemental benefit plans that allow participants to (i) make tax-
deferred contributions and (ii) receive Company-provided
allocations that cannot be made under the Profit Sharing and
Savings Plan because of IRS limitations. The investment
alternatives and returns are based on certain market-rate
investment alternatives under the Profit Sharing and Savings Plan.
Total liabilities were $534.0 million at December 31, 2014, and
$531.1 million at December 31, 2013, and were primarily included
in other long-term liabilities on the Consolidated balance sheet.
The Company has entered into derivative contracts to hedge
market-driven changes in certain of the liabilities. At December 31,
2014, derivatives with a fair value of $115.9 million indexed to the
Company's stock and a total return swap with a notional amount of
$206.3 million indexed to certain market indices were included at
their fair value in Prepaid expenses and other current assets on
the Consolidated balance sheet. Changes in liabilities for these
nonqualified plans and in the fair value of the derivatives are
recorded primarily in Selling, general & administrative expenses.
Changes in fair value of the derivatives indexed to the Company’s
stock are recorded in the income statement because the contracts
provide the counterparty with a choice to settle in cash or shares.
Total U.S. costs for the Profit Sharing and Savings Plan,
including nonqualified benefits and related hedging activities, were
(in millions): 2014–$29.1; 2013–$21.9; 2012–$27.9. Certain
subsidiaries outside the U.S. also offer profit sharing, stock
purchase or other similar benefit plans. Total plan costs outside
the U.S. were (in millions): 2014–$54.4; 2013–$51.2; 2012–$62.5.
The total combined liabilities for international retirement plans
were $74.7 million and $75.0 million at December 31, 2014 and
2013, respectively. Other post-retirement benefits and post-
employment benefits were immaterial.
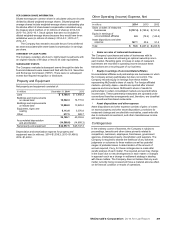
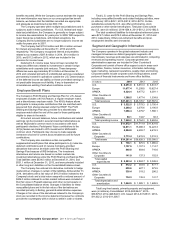
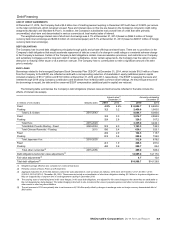
Segment and Geographic Information
The Company operates in the global restaurant industry and
manages its business as distinct geographic segments. All
intercompany revenues and expenses are eliminated in computing
revenues and operating income. Corporate general and
administrative expenses are included in Other Countries &
Corporate and consist of home office support costs in areas such
as facilities, finance, human resources, information technology,
legal, marketing, restaurant operations, supply chain and training.
Corporate assets include corporate cash and equivalents, asset
portions of financial instruments and home office facilities.
In millions 2014 2013 2012
U.S. $ 8,651.0 $ 8,851.3 $ 8,813.7
Europe 11,077.4 11,299.8 10,827.4
APMEA 6,324.4 6,477.2 6,391.1
Other Countries &
Corporate 1,388.5 1,477.4 1,534.8
Total revenues $27,441.3 $28,105.7 $27,567.0
U.S. $ 3,522.5 $ 3,779.3 $ 3,750.4
Europe 3,280.2 3,370.6 3,195.8
APMEA 1,066.4 1,479.7 1,566.1
Other Countries &
Corporate 80.1 134.7 92.3
Total operating income $ 7,949.2 $ 8,764.3 $ 8,604.6
U.S. $11,872.1 $11,711.8 $11,431.6
Europe 12,811.1 15,096.3 14,223.3
APMEA 5,884.8 6,202.7 6,419.3
Other Countries &
Corporate 3,713.4 3,615.5 3,312.3
Total assets $34,281.4 $36,626.3 $35,386.5
U.S. $ 736.1 $ 875.5 $ 1,065.0
Europe 1,157.5 1,157.3 1,114.7
APMEA 548.8 654.6 716.6
Other Countries &
Corporate 141.0 137.3 152.9
Total capital
expenditures $ 2,583.4 $ 2,824.7 $ 3,049.2
U.S. $ 512.2 $ 503.6 $ 477.1
Europe 659.6 627.1 573.5
APMEA 338.4 319.2 296.2
Other Countries &
Corporate 134.3 135.2 141.7
Total depreciation and
amortization $ 1,644.5 $ 1,585.1 $ 1,488.5
Total long-lived assets, primarily property and equipment,
were (in millions)–Consolidated: 2014–$29,264.7; 2013–
$30,679.8; 2012–$29,644.5; U.S. based: 2014–$11,883.1; 2013–
$11,632.2; 2012–$11,308.7.