McDonalds 2014 Annual Report Download - page 26
Download and view the complete annual report
Please find page 26 of the 2014 McDonalds annual report below. You can navigate through the pages in the report by either clicking on the pages listed below, or by using the keyword search tool below to find specific information within the annual report.-
 1
1 -
2
-
3
-
4
-
5
-
6
-
7
-
8
-
9
-
10
-
11
-
12
-
13
-
14
-
15
-
 16
16 -
 17
17 -
 18
18 -
 19
19 -
 20
20 -
 21
21 -
 22
22 -
 23
23 -
 24
24 -
 25
25 -
 26
26 -
 27
27 -
 28
28 -
 29
29 -
 30
30 -
 31
31 -
 32
32 -
 33
33 -
 34
34 -
 35
35 -
 36
36 -
37
-
38
-
39
-
40
-
41
-
42
-
43
-
44
-
45
-
46
-
47
-
48
-
49
-
50
-
51
-
52
-
53
-
54
-
55
-
56
-
57
-
58
-
59
-
60
-
61
-
62
-
63
-
64
 |
 |

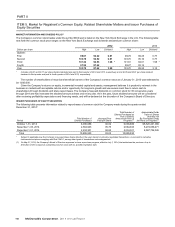
20 McDonald’s Corporation 2014 Annual Report
In Europe, the franchised margin percent decreased in 2014
primarily due to the impact of refranchising and negative
comparable sales. The decrease in 2013 was due to higher rent
expense in many markets and weak comparable sales primarily
due to Germany.
In APMEA, the franchised margin percent decreased in 2014
partly due to the negative impact of the supplier issue in Japan,
which reduced Japan's favorable contribution to the segment's
margin percent. In addition, higher occupancy costs and
refranchising negatively impacted the margin percent. The
decrease in 2013 was partly due to Japan's negative sales
performance and the impact of the weaker Yen. In addition, the
segment was negatively impacted by a decline in Australia's
results.
In connection with our 2014-2016 cash return target, we plan
to refranchise at least 1,500 restaurants by selling company-
operated restaurants to conventional franchisees and
developmental licensees. While this refranchising activity may
have a dilutive effect on the franchised margin percent, it results in
higher franchised margin dollars.
In addition, the franchised margin percent in APMEA and
Other Countries & Corporate is higher relative to the U.S. and
Europe due to a larger proportion of developmental licensed and/
or affiliated restaurants where the Company receives royalty
income with no corresponding occupancy costs.
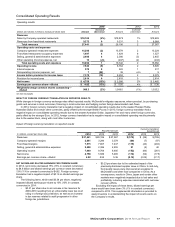
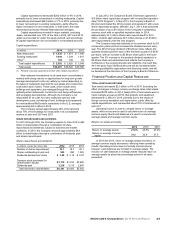
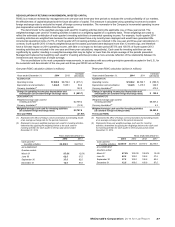
Company-operated margins
Company-operated margin dollars represent sales by Company-
operated restaurants less the operating costs of these restaurants.
Company-operated margin dollars decreased $415 million or 13%
(11% in constant currencies) in 2014, reflecting weak results
across all segments. In 2013, Company-operated margin dollars
decreased $83 million or 2% (2% in constant currencies),
reflecting weak comparable sales in many markets, which
impacted our ability to overcome cost pressures.
Company-operated margins
In millions 2014 2013 2012
U.S. $ 756 $ 830 $ 883
Europe 1,423 1,566 1,501
APMEA 585 771 849
Other Countries & Corporate 117 129 146
Total $ 2,881 $ 3,296 $ 3,379
Percent of sales
U.S. 17.4% 18.4% 19.5%
Europe 18.2 19.2 19.1
APMEA 11.1 14.2 15.9
Other Countries & Corporate 15.8 16.0 16.8
Total 15.9% 17.5% 18.2%
In the U.S., the Company-operated margin percent decreased
in 2014 due to the impact of negative comparable guest counts
and higher commodity and labor costs, partly offset by a higher
average check. The margin percent decreased in 2013 primarily
due to higher labor, commodity costs and other operating costs.
Europe’s Company-operated margin percent decreased in
2014 reflecting weaker results in Russia and Ukraine, as a
challenging operating environment negatively impacted
comparable sales performance and weaker currencies impacted
imported commodity costs. The margin percent increased in 2013
due to the positive impact of sales performance in Russia, the
U.K. and France, mostly offset by higher commodity and
occupancy costs.
In APMEA, the Company-operated margin percent decreased
in 2014 primarily due to the negative impact of the supplier issue
in China and certain other markets. The margin percent decreased
in 2013 primarily due to higher labor, occupancy and other costs,
and negative comparable guest counts, partly offset by a higher
average check.
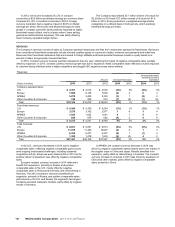
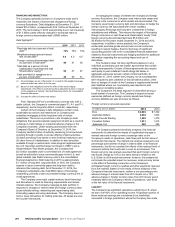
SELLING, GENERAL & ADMINISTRATIVE EXPENSES
Consolidated selling, general and administrative expenses increased 4% (5% in constant currencies) in 2014 and decreased 3% (3% in
constant currencies) in 2013. The increase in 2014 was primarily due to higher employee and other costs, the 2014 Winter Olympics and
the Worldwide Owner/Operator Convention, partly offset by a reduction in incentive-based compensation. The decrease in 2013 was due to
lower incentive-based compensation, partly offset by higher employee costs. In addition, 2013 benefited from the comparison to costs in
2012 related to the London Olympics and the Worldwide Owner/Operator Convention.
Selling, general & administrative expenses
Amount Increase/(decrease)
Increase/(decrease)
excluding currency
translation
Dollars in millions 2014 2013 2012 2014 2013 2014 2013
U.S. $ 772 $ 740 $ 782 4% (5%) 4% (5%)
Europe 741 703 695 5160
APMEA 387 355 353 9111 1
Other Countries & Corporate(1) 588 588 625 0(6) 1(6)
Total $ 2,488 $ 2,386 $ 2,455 4% (3%) 5% (3%)
(1) Included in Other Countries & Corporate are home office support costs in areas such as facilities, finance, human resources, information technology, legal,
marketing, restaurant operations, supply chain and training.
Selling, general and administrative expenses as a percent of revenues was 9.1% in 2014, 8.5% in 2013 and 8.9% in 2012. Selling,
general and administrative expenses as a percent of Systemwide sales was 2.8% in 2014, 2.7% in 2013 and 2.8% in 2012. Management
believes that analyzing selling, general and administrative expenses as a percent of Systemwide sales, as well as revenues, is meaningful
because these costs are incurred to support the overall McDonald's business.