McDonalds 2014 Annual Report Download - page 29
Download and view the complete annual report
Please find page 29 of the 2014 McDonalds annual report below. You can navigate through the pages in the report by either clicking on the pages listed below, or by using the keyword search tool below to find specific information within the annual report.-
 1
1 -
2
-
3
-
4
-
5
-
6
-
7
-
8
-
9
-
10
-
11
-
12
-
13
-
14
-
15
-
16
-
17
-
18
-
 19
19 -
 20
20 -
 21
21 -
 22
22 -
 23
23 -
 24
24 -
 25
25 -
 26
26 -
 27
27 -
 28
28 -
 29
29 -
 30
30 -
 31
31 -
 32
32 -
 33
33 -
 34
34 -
 35
35 -
 36
36 -
 37
37 -
 38
38 -
 39
39 -
40
-
41
-
42
-
43
-
44
-
45
-
46
-
47
-
48
-
49
-
50
-
51
-
52
-
53
-
54
-
55
-
56
-
57
-
58
-
59
-
60
-
61
-
62
-
63
-
64
 |
 |

McDonald’s Corporation 2014 Annual Report 23
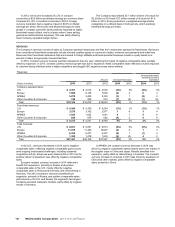
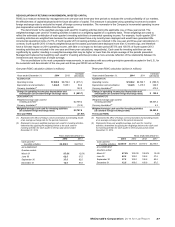
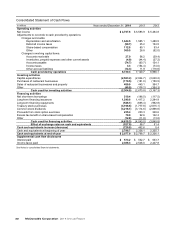
Capital expenditures decreased $242 million or 9% in 2014,
primarily due to lower reinvestment in existing restaurants. Capital
expenditures decreased $224 million or 7% in 2013, primarily due
to lower reinvestment in existing restaurants, partly offset by
higher investment in new restaurants. In both years, the lower
reinvestment primarily reflected fewer planned reimages.
Capital expenditures invested in major markets, excluding
Japan, represented over 70% of the total in 2014, 2013 and 2012.
Japan is accounted for under the equity method, and accordingly
its capital expenditures are not included in consolidated amounts.
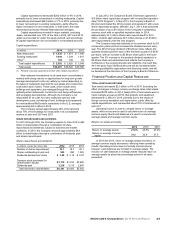
Capital expenditures
In millions 2014 2013 2012
New restaurants $ 1,435 $ 1,473 $ 1,340
Existing restaurants 1,044 1,244 1,615
Other(1) 104 108 94
Total capital expenditures $ 2,583 $ 2,825 $ 3,049
Total assets $34,281 $36,626 $35,386
(1) Primarily corporate equipment and other office-related expenditures.
New restaurant investments in all years were concentrated in
markets with strong returns or opportunities for long-term growth.
Average development costs vary widely by market depending on
the types of restaurants built and the real estate and construction
costs within each market. These costs, which include land,
buildings and equipment, are managed through the use of
optimally-sized restaurants, construction and design efficiencies,
and leveraging best practices. Although the Company is not
responsible for all costs for every restaurant opened, total
development costs (consisting of land, buildings and equipment)
for new traditional McDonald’s restaurants in the U.S. averaged
approximately $3.2 million in 2014.
The Company owned approximately 45% of the land and
about 70% of the buildings for restaurants in its consolidated
markets at year-end 2014 and 2013.
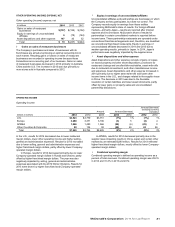
SHARE REPURCHASES AND DIVIDENDS
For 2014 through 2016, the Company expects to return $18 to $20
billion to shareholders through a combination of share
repurchases and dividends, subject to business and market
conditions. In 2014, the Company returned approximately $6.4
billion to shareholders through a combination of dividends paid
and shares repurchased.
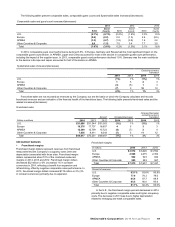
Shares repurchased and dividends
In millions, except per share data 2014 2013 2012
Number of shares repurchased 33.1 18.7 28.1
Shares outstanding at year end 963 990 1,003
Dividends declared per share $ 3.28 $ 3.12 $ 2.87
Treasury stock purchases (in
Shareholders' equity) $ 3,175 $1,810 $2,605
Dividends paid 3,216 3,115 2,897
Total returned to shareholders $ 6,391 $4,925 $5,502
In July 2012, the Company’s Board of Directors approved a
$10 billion share repurchase program with no specified expiration
date ("2012 Program"). In May 2014, the Company's Board of
Directors terminated the 2012 program and replaced it with a new
share repurchase program, effective July 1, 2014, that authorizes
the purchase of up to $10 billion of the Company's outstanding
common stock with no specified expiration date. In 2014,
approximately 33.1 million shares were repurchased for $3.2
billion, of which approximately 20.5 million shares or $1.9 billion
were repurchased under the new program.
The Company has paid dividends on its common stock for 39
consecutive years and has increased the dividend amount every
year. The 2014 full year dividend of $3.28 per share reflects the
quarterly dividend paid for each of the first three quarters of $0.81
per share, with an increase to $0.85 per share paid in the fourth
quarter. This 5% increase in the quarterly dividend equates to a
$3.40 per share annual dividend and reflects the Company’s
confidence in the ongoing strength and reliability of its cash flow.
As in the past, future dividend amounts will be considered after
reviewing profitability expectations and financing needs, and will
be declared at the discretion of the Company’s Board of Directors.
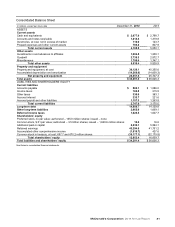
Financial Position and Capital Resources
TOTAL ASSETS AND RETURNS
Total assets decreased $2.3 billion or 6% in 2014. Excluding the
effect of changes in foreign currency exchange rates, total assets
increased $578 million in 2014. Nearly 80% of total assets were in
major markets at year-end 2014. Net property and equipment
decreased $1.2 billion in 2014, primarily due to the impact of
foreign currency translation and depreciation, partly offset by
capital expenditures, and represented about 70% of total assets at
year end.
Operating income is used to compute return on average
assets, while net income is used to calculate return on average
common equity. Month-end balances are used to compute both
average assets and average common equity.
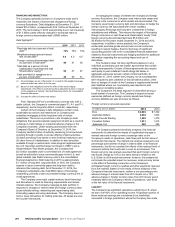
Returns on assets and equity
2014 2013 2012
Return on average assets 21.8% 24.8% 25.4%
Return on average common
equity 31.3 35.8 37.5
In 2014 and 2013, return on average assets and return on
average common equity decreased, reflecting lower operating
results. Operating income does not include interest income;
however, cash balances are included in average assets. The
inclusion of cash balances in average assets reduced return on
average assets by about two percentage points for all years
presented.