McDonalds 2014 Annual Report Download - page 27
Download and view the complete annual report
Please find page 27 of the 2014 McDonalds annual report below. You can navigate through the pages in the report by either clicking on the pages listed below, or by using the keyword search tool below to find specific information within the annual report.-
 1
1 -
2
-
3
-
4
-
5
-
6
-
7
-
8
-
9
-
10
-
11
-
12
-
13
-
14
-
15
-
16
-
 17
17 -
 18
18 -
 19
19 -
 20
20 -
 21
21 -
 22
22 -
 23
23 -
 24
24 -
 25
25 -
 26
26 -
 27
27 -
 28
28 -
 29
29 -
 30
30 -
 31
31 -
 32
32 -
 33
33 -
 34
34 -
 35
35 -
 36
36 -
 37
37 -
38
-
39
-
40
-
41
-
42
-
43
-
44
-
45
-
46
-
47
-
48
-
49
-
50
-
51
-
52
-
53
-
54
-
55
-
56
-
57
-
58
-
59
-
60
-
61
-
62
-
63
-
64
 |
 |

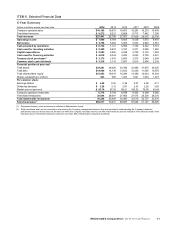
McDonald’s Corporation 2014 Annual Report 21
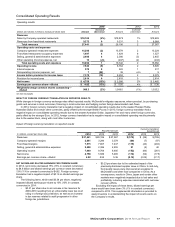
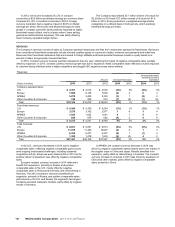
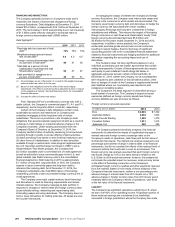
OTHER OPERATING (INCOME) EXPENSE, NET
Other operating (income) expense, net
In millions 2014 2013 2012
Gains on sales of restaurant
businesses $(137) $(199) $(152)
Equity in earnings of unconsolidated
affiliates 9(78) (144)
Asset dispositions and other expense 147 30 52
Total $ 19 $(247) $(244)
Gains on sales of restaurant businesses
The Company’s purchases and sales of businesses with its
franchisees are aimed at achieving an optimal ownership mix in
each market. Resulting gains or losses on sales of restaurant
businesses are recorded in operating income because these
transactions are a recurring part of our business. Gains on sales
of restaurant businesses decreased in 2014 primarily in Australia,
China and the U.S. The increase in 2013 was due primarily to
more stores sold in Australia compared to 2012.
Equity in earnings of unconsolidated affiliates
Unconsolidated affiliates and partnerships are businesses in which
the Company actively participates, but does not control. The
Company records equity in earnings from these entities
representing McDonald’s share of results. For foreign affiliated
markets—primarily Japan—results are reported after interest
expense and income taxes. McDonald’s share of results for
partnerships in certain consolidated markets is reported before
income taxes. These partnership restaurants are operated under
conventional franchise arrangements and, therefore, are classified
as conventional franchised restaurants. Equity in earnings of
unconsolidated affiliates decreased in 2014 and 2013 due to
weaker operating results, primarily in Japan. In 2014, Japan's
performance was negatively impacted by the supplier issue.
Asset dispositions and other expense
Asset dispositions and other expense consists of gains or losses
on excess property and other asset dispositions, provisions for
restaurant closings and uncollectible receivables, asset write-offs
due to restaurant reinvestment, and other miscellaneous income
and expenses. Asset dispositions and other expense increased in
2014 primarily due to higher asset write-offs and lower other
income items in the U.S., and charges related to the supplier issue
in China. The decrease in 2013 was due to the favorable
resolution of certain liabilities and lower asset retirements, partly
offset by lower gains on property sales and unconsolidated
partnership dissolutions.
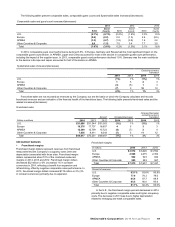
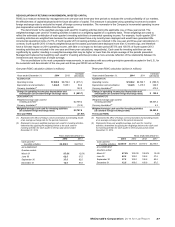
OPERATING INCOME
Operating income
Amount Increase/(decrease)
Increase/(decrease)
excluding currency
translation
Dollars in millions 2014 2013 2012 2014 2013 2014 2013
U.S. $3,523 $3,779 $3,751 (7%) 1% (7%) 1%
Europe 3,280 3,371 3,196 (3) 5(2) 4
APMEA 1,066 1,480 1,566 (28) (6) (25) 0
Other Countries & Corporate 80 134 92 (40) 46 24 86
Total $7,949 $8,764 $8,605 (9%) 2% (8%) 3%
In the U.S., results for 2014 decreased due to lower restaurant
margin dollars, lower other operating income and higher selling,
general and administrative expenses. Results for 2013 increased
due to lower selling, general and administrative expenses and
higher franchised margin dollars, partly offset by lower Company-
operated margin dollars.
In Europe, results for 2014 decreased primarily due to lower
Company-operated margin dollars in Russia and Ukraine, partly
offset by higher franchised margin dollars. The year was also
negatively impacted by selling, general and administrative
expenses associated with the 2014 Winter Olympics. Results for
2013 were driven by higher franchised and Company-operated
margin dollars.
In APMEA, results for 2014 decreased primarily due to the
supplier issue impacting results in China, Japan and certain other
markets by an estimated $290 million. Results for 2013 reflected
higher franchised margin dollars, mostly offset by lower Company-
operated margin dollars.
Combined operating margin
Combined operating margin is defined as operating income as a
percent of total revenues. Combined operating margin was 29.0%
in 2014 and 31.2% in 2013 and 2012.