McDonalds 2014 Annual Report Download - page 25
Download and view the complete annual report
Please find page 25 of the 2014 McDonalds annual report below. You can navigate through the pages in the report by either clicking on the pages listed below, or by using the keyword search tool below to find specific information within the annual report.-
 1
1 -
2
-
3
-
4
-
5
-
6
-
7
-
8
-
9
-
10
-
11
-
12
-
13
-
14
-
 15
15 -
 16
16 -
 17
17 -
 18
18 -
 19
19 -
 20
20 -
 21
21 -
 22
22 -
 23
23 -
 24
24 -
 25
25 -
 26
26 -
 27
27 -
 28
28 -
 29
29 -
 30
30 -
 31
31 -
 32
32 -
 33
33 -
 34
34 -
 35
35 -
36
-
37
-
38
-
39
-
40
-
41
-
42
-
43
-
44
-
45
-
46
-
47
-
48
-
49
-
50
-
51
-
52
-
53
-
54
-
55
-
56
-
57
-
58
-
59
-
60
-
61
-
62
-
63
-
64
 |
 |

McDonald’s Corporation 2014 Annual Report 19
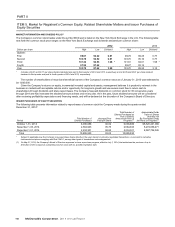
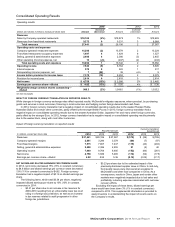
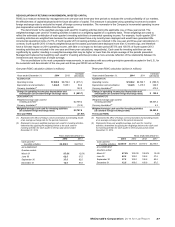
The following tables present comparable sales, comparable guest counts and Systemwide sales increases/(decreases):
Comparable sales and guest count increases/(decreases)
2014 2013 2012
Sales Guest
Counts Sales Guest
Counts Sales Guest
Counts
U.S. (2.1%) (4.1%) (0.2%) (1.6%) 3.3% 1.9%
Europe (0.6) (2.2) 0.0 (1.5) 2.4 (0.5)
APMEA (3.3) (4.7) (1.9) (3.8) 1.4 2.2
Other Countries & Corporate 6.6 (1.5) 7.0 0.4 7.7 3.0
Total (1.0%) (3.6%) 0.2% (1.9%) 3.1% 1.6%
In 2014, comparable guest count performance declined 3.6%. In Europe, Germany and Russia had the most significant impact on the
comparable guest count decline. In APMEA, Japan and China accounted for most of the decline in comparable guest count performance,
including the impact of the supplier issue. In 2013, comparable guest count performance declined 1.9%. Germany was the main contributor
to the decline in Europe and Japan accounted for half of the decline in APMEA.
Systemwide sales increases/(decreases)
Excluding currency
translation
2014 2013 2014 2013
U.S. (1%) 1% (1%) 1%
Europe 1523
APMEA (3) (5) 13
Other Countries & Corporate (7) 310 10
Total (2%) 1% 1% 3%
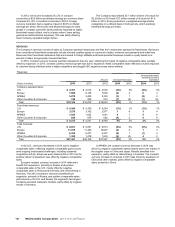
Franchised sales are not recorded as revenues by the Company, but are the basis on which the Company calculates and records
franchised revenues and are indicative of the financial health of the franchisee base. The following table presents franchised sales and the
related increases/(decreases):
Franchised sales
Amount Increase/(decrease)
Increase/(decrease)
excluding currency
translation
Dollars in millions 2014 2013 2012 2014 2013 2014 2013
U.S. $31,096 $31,344 $31,063 (1%) 1% (1%) 1%
Europe 18,376 17,737 16,857 4533
APMEA 12,309 12,759 13,723 (4) (7) 24
Other Countries & Corporate 7,836 8,411 8,044 (7) 511 12
Total $69,617 $70,251 $69,687 (1%) 1% 2% 3%
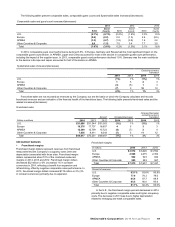
RESTAURANT MARGINS
Franchised margins
Franchised margin dollars represent revenues from franchised
restaurants less the Company’s occupancy costs (rent and
depreciation) associated with those sites. Franchised margin
dollars represented about 70% of the combined restaurant
margins in 2014, 2013 and 2012. Franchised margin dollars
decreased $32 million or 0% (increased 1% in constant
currencies) in 2014, reflecting a benefit from expansion and
refranchising, offset by negative comparable sales performance. In
2013, franchised margin dollars increased $170 million or 2% (3%
in constant currencies) primarily due to expansion.
Franchised margins
In millions 2014 2013 2012
U.S. $ 3,572 $ 3,626 $ 3,594
Europe 2,546 2,475 2,352
APMEA 902 923 924
Other Countries & Corporate 555 583 567
Total $ 7,575 $ 7,607 $ 7,437
Percent of revenues
U.S. 83.1% 83.6% 83.9%
Europe 77.9 78.3 79.0
APMEA 85.6 87.7 88.8
Other Countries & Corporate 85.5 86.0 85.6
Total 81.7% 82.4% 83.0%
In the U.S., the franchised margin percent decreased in 2014
primarily due to negative comparable sales and higher occupancy
costs. The decrease in 2013 was due to higher depreciation
related to reimaging and weak comparable sales.