McDonalds 2014 Annual Report Download - page 23
Download and view the complete annual report
Please find page 23 of the 2014 McDonalds annual report below. You can navigate through the pages in the report by either clicking on the pages listed below, or by using the keyword search tool below to find specific information within the annual report.-
 1
1 -
2
-
3
-
4
-
5
-
6
-
7
-
8
-
9
-
10
-
11
-
12
-
 13
13 -
 14
14 -
 15
15 -
 16
16 -
 17
17 -
 18
18 -
 19
19 -
 20
20 -
 21
21 -
 22
22 -
 23
23 -
 24
24 -
 25
25 -
 26
26 -
 27
27 -
 28
28 -
 29
29 -
 30
30 -
 31
31 -
 32
32 -
 33
33 -
34
-
35
-
36
-
37
-
38
-
39
-
40
-
41
-
42
-
43
-
44
-
45
-
46
-
47
-
48
-
49
-
50
-
51
-
52
-
53
-
54
-
55
-
56
-
57
-
58
-
59
-
60
-
61
-
62
-
63
-
64
 |
 |

McDonald’s Corporation 2014 Annual Report 17
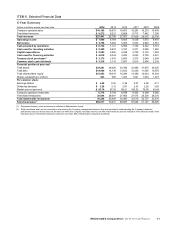
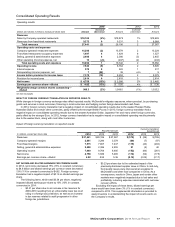
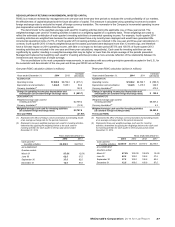
Consolidated Operating Results
Operating results
2014 2013 2012
Dollars and shares in millions, except per share data Amount
Increase/
(decrease) Amount
Increase/
(decrease) Amount
Revenues
Sales by Company-operated restaurants $18,169 (4%) $18,875 1% $18,603
Revenues from franchised restaurants 9,272 0 9,231 3 8,964
Total revenues 27,441 (2) 28,106 2 27,567
Operating costs and expenses
Company-operated restaurant expenses 15,288 (2) 15,579 2 15,224
Franchised restaurants-occupancy expenses 1,697 4 1,624 6 1,527
Selling, general & administrative expenses 2,488 4 2,386 (3) 2,455
Other operating (income) expense, net 19 n/m (247) (2) (244)
Total operating costs and expenses 19,492 1 19,342 2 18,962
Operating income 7,949 (9) 8,764 2 8,605
Interest expense 570 9 522 1 517
Nonoperating (income) expense, net 7 (82) 38 n/m 9
Income before provision for income taxes 7,372 (10) 8,204 2 8,079
Provision for income taxes 2,614 0 2,618 0 2,614
Net income $ 4,758 (15%) $ 5,586 2% $ 5,465
Earnings per common share—diluted $ 4.82 (13%) $ 5.55 4% $ 5.36
Weighted-average common shares outstanding—
diluted 986.3 (2%) 1,006.0 (1%) 1,020.2
n/m Not meaningful
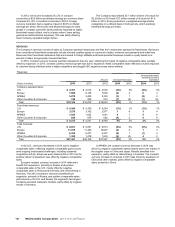
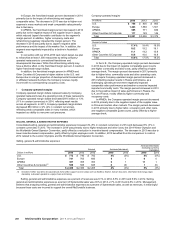
IMPACT OF FOREIGN CURRENCY TRANSLATION ON REPORTED RESULTS
While changes in foreign currency exchange rates affect reported results, McDonald’s mitigates exposures, where practical, by purchasing
goods and services in local currencies, financing in local currencies and hedging certain foreign-denominated cash flows.
In 2014, foreign currency translation had a negative impact on consolidated operating results due to the weaker Russian Ruble,
Australian Dollar and certain other currencies, partly offset by the stronger British Pound. In 2013, foreign currency translation had a
negative impact on consolidated operating results due to the weaker Australian Dollar, Japanese Yen and many other foreign currencies,
partly offset by the stronger Euro. In 2012, foreign currency translation had a negative impact on consolidated operating results primarily
due to the weaker Euro, along with most other currencies.
Impact of foreign currency translation on reported results
Reported amount Currency translation
benefit/(cost)
In millions, except per share data 2014 2013 2012 2014 2013 2012
Revenues $ 27,441 $ 28,106 $ 27,567 $ (570) $ (29) $ (726)
Company-operated margins 2,881 3,296 3,379 (60) (7) (97)
Franchised margins 7,575 7,607 7,437 (119) (43) (204)
Selling, general & administrative expenses 2,488 2,386 2,455 21 (5) 40
Operating income 7,949 8,764 8,605 (152) (66) (261)
Net income 4,758 5,586 5,465 (114) (52) (178)
Earnings per common share—diluted 4.82 5.55 5.36 (0.12) (0.05) (0.17)
NET INCOME AND DILUTED EARNINGS PER COMMON SHARE
In 2014, net income decreased 15% (13% in constant currencies)
to $4.8 billion and diluted earnings per common share decreased
13% (11% in constant currencies) to $4.82. Foreign currency
translation had a negative impact of $0.12 on diluted earnings per
share.
The following items, which total $0.54 per share, negatively
impacted diluted earnings per share by 10% (10% in constant
currencies) in 2014:
• $0.31 per share due to an increase in tax reserves for
2003-2010 resulting from an unfavorable lower tax court
ruling in a foreign tax jurisdiction, as well as an increase
in tax reserves related to audit progression in other
foreign tax jurisdictions.
• $0.23 per share due to the estimated impact of the
previously-disclosed supplier issue in China. In mid-July,
food quality issues were discovered at a supplier to
McDonald's and other food companies in China. As a
consequence, results in China, Japan and certain other
markets were negatively impacted due to lost sales and
profitability, including expenses associated with customer
recovery efforts.
Excluding the impact of these items, diluted earnings per
share would have been down 3% (1% in constant currencies)
compared to 2013. This supplemental information is provided to
assist investors in understanding the impact of recent events on
the Company's results.