McDonalds 2014 Annual Report Download - page 40
Download and view the complete annual report
Please find page 40 of the 2014 McDonalds annual report below. You can navigate through the pages in the report by either clicking on the pages listed below, or by using the keyword search tool below to find specific information within the annual report.-
 1
1 -
2
-
3
-
4
-
5
-
6
-
7
-
8
-
9
-
10
-
11
-
12
-
13
-
14
-
15
-
16
-
17
-
18
-
19
-
20
-
21
-
22
-
23
-
24
-
25
-
26
-
27
-
28
-
29
-
 30
30 -
 31
31 -
 32
32 -
 33
33 -
 34
34 -
 35
35 -
 36
36 -
 37
37 -
 38
38 -
 39
39 -
 40
40 -
 41
41 -
 42
42 -
 43
43 -
 44
44 -
 45
45 -
 46
46 -
 47
47 -
 48
48 -
 49
49 -
 50
50 -
51
-
52
-
53
-
54
-
55
-
56
-
57
-
58
-
59
-
60
-
61
-
62
-
63
-
64
 |
 |

34 McDonald’s Corporation 2014 Annual Report
Notes to Consolidated Financial Statements
Summary of Significant Accounting Policies
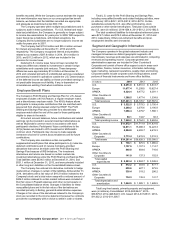
NATURE OF BUSINESS
The Company franchises and operates McDonald’s restaurants in
the global restaurant industry. All restaurants are operated either
by the Company or by franchisees, including conventional
franchisees under franchise arrangements, and foreign affiliates
and developmental licensees under license agreements.
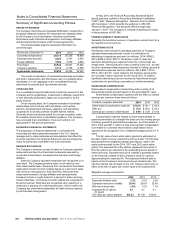
The following table presents restaurant information by
ownership type:
Restaurants at December 31, 2014 2013 2012
Conventional franchised 20,774 20,355 19,869
Developmental licensed 5,228 4,747 4,350
Foreign affiliated 3,542 3,589 3,663
Franchised 29,544 28,691 27,882
Company-operated 6,714 6,738 6,598
Systemwide restaurants 36,258 35,429 34,480
The results of operations of restaurant businesses purchased
and sold in transactions with franchisees were not material either
individually or in the aggregate to the consolidated financial
statements for periods prior to purchase and sale.
CONSOLIDATION
The consolidated financial statements include the accounts of the
Company and its subsidiaries. Investments in affiliates owned 50%
or less (primarily McDonald’s Japan) are accounted for by the
equity method.
On an ongoing basis, the Company evaluates its business
relationships such as those with franchisees, joint venture
partners, developmental licensees, suppliers, and advertising
cooperatives to identify potential variable interest entities.
Generally, these businesses qualify for a scope exception under
the variable interest entity consolidation guidance. The Company
has concluded that consolidation of any such entity is not
appropriate for the periods presented.
ESTIMATES IN FINANCIAL STATEMENTS
The preparation of financial statements in conformity with
accounting principles generally accepted in the U.S. requires
management to make estimates and assumptions that affect the
amounts reported in the financial statements and accompanying
notes. Actual results could differ from those estimates.
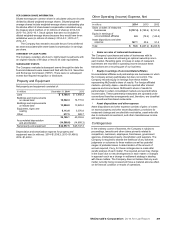
REVENUE RECOGNITION
The Company’s revenues consist of sales by Company-operated
restaurants and fees from franchised restaurants operated by
conventional franchisees, developmental licensees and foreign
affiliates.
Sales by Company-operated restaurants are recognized on a
cash basis. The Company presents sales net of sales tax and
other sales-related taxes. Revenues from conventional franchised
restaurants include rent and royalties based on a percent of sales
with minimum rent payments, and initial fees. Revenues from
restaurants licensed to foreign affiliates and developmental
licensees include a royalty based on a percent of sales, and may
include initial fees. Continuing rent and royalties are recognized in
the period earned. Initial fees are recognized upon opening of a
restaurant or granting of a new franchise term, which is when the
Company has performed substantially all initial services required
by the franchise arrangement.
In May 2014, the Financial Accounting Standards Board
issued guidance codified in Accounting Standards Codification
("ASC") 606, "Revenue Recognition - Revenue from Contracts
with Customers," which amends the guidance in ASC 605,
"Revenue Recognition," and becomes effective beginning
January 1, 2017. The Company is currently evaluating the impact
of the provisions of ASC 606.
FOREIGN CURRENCY TRANSLATION
Generally, the functional currency of operations outside the U.S. is
the respective local currency.
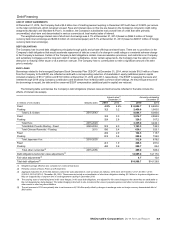
ADVERTISING COSTS
Advertising costs included in operating expenses of Company-
operated restaurants primarily consist of contributions to
advertising cooperatives and were (in millions): 2014–$808.2;
2013–$808.4; 2012–$787.5. Production costs for radio and
television advertising are expensed when the commercials are
initially aired. These production costs, primarily in the U.S., as well
as other marketing-related expenses included in Selling, general &
administrative expenses were (in millions): 2014–$98.7; 2013–
$75.4; 2012–$113.5. Costs related to the Olympics sponsorship
are included in these expenses for 2014 and 2012. In addition,
significant advertising costs are incurred by franchisees through
contributions to advertising cooperatives in individual markets.
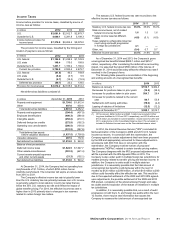
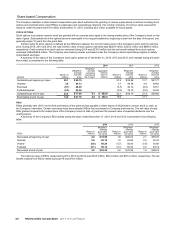
SHARE-BASED COMPENSATION
Share-based compensation includes the portion vesting of all
share-based awards granted based on the grant date fair value.
Share-based compensation expense and the effect on diluted
earnings per common share were as follows:
In millions, except per share data 2014 2013 2012
Share-based compensation expense $112.8 $ 89.1 $ 93.4
After tax $ 72.8 $ 60.6 $ 63.2
Earnings per common share-diluted $ 0.08 $ 0.06 $ 0.06
Compensation expense related to share-based awards is
generally amortized on a straight-line basis over the vesting period
in Selling, general & administrative expenses. As of December 31,
2014, there was $97.3 million of total unrecognized compensation
cost related to nonvested share-based compensation that is
expected to be recognized over a weighted-average period of 1.9
years.
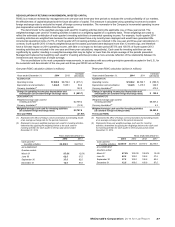
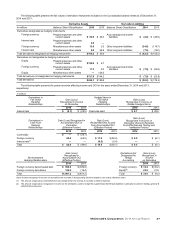
The fair value of each stock option granted is estimated on
the date of grant using a closed-form pricing model. The following
table presents the weighted-average assumptions used in the
option pricing model for the 2014, 2013 and 2012 stock option
grants. The expected life of the options represents the period of
time the options are expected to be outstanding and is based on
historical trends. Expected stock price volatility is generally based
on the historical volatility of the Company’s stock for a period
approximating the expected life. The expected dividend yield is
based on the Company’s most recent annual dividend rate. The
risk-free interest rate is based on the U.S. Treasury yield curve in
effect at the time of grant with a term equal to the expected life.
Weighted-average assumptions
2014 2013 2012
Expected dividend yield 3.3% 3.5% 2.8%
Expected stock price volatility 20.0% 20.6% 20.8%
Risk-free interest rate 2.0% 1.2% 1.1%
Expected life of options
(in years)
6.1 6.1 6.1
Fair value per option granted $12.23 $11.09 $13.65