Nike 2006 Annual Report Download - page 19
Download and view the complete annual report
Please find page 19 of the 2006 Nike annual report below. You can navigate through the pages in the report by either clicking on the pages listed below, or by using the keyword search tool below to find specific information within the annual report.-
 1
1 -
2
-
3
-
4
-
5
-
6
-
7
-
8
-
 9
9 -
 10
10 -
 11
11 -
 12
12 -
 13
13 -
 14
14 -
 15
15 -
 16
16 -
 17
17 -
 18
18 -
 19
19 -
 20
20 -
 21
21 -
 22
22 -
 23
23 -
 24
24 -
 25
25 -
 26
26 -
 27
27 -
 28
28 -
 29
29 -
30
-
31
-
32
-
33
-
34
-
35
-
36
-
37
-
38
-
39
-
40
-
41
-
42
-
43
-
44
-
45
-
46
-
47
-
48
-
49
-
50
-
51
-
52
-
53
-
54
-
55
-
56
-
57
-
58
-
59
-
60
-
61
-
62
-
63
-
64
-
65
-
66
-
67
-
68
-
69
-
70
-
71
-
72
-
73
-
74
-
75
-
76
-
77
-
78
-
79
-
80
-
81
-
82
-
83
-
84
 |
 |

PART II
Item 5. Market for Registrant’s Common Equity, Related Stockholder Matters and Issuer Purchases of
Equity Securities
NIKE’s Class B Common Stock is listed on the New York Stock Exchange and trades under the symbol
NKE. At July 25, 2006, there were 19,348 holders of record of our Class B Common Stock and 18 holders of
record of our Class A Common Stock. These figures do not include beneficial owners who hold shares in
nominee name. The Class A Common Stock is not publicly traded but each share is convertible upon request of
the holder into one share of Class B Common Stock.
We refer to the table entitled “Selected Quarterly Financial Data” in Item 6, which lists, for the periods
indicated, the range of high and low stock prices on the New York Stock Exchange. That table also describes the
amount and frequency of all cash dividends declared on our Class B Common Stock for the 2006 and 2005 fiscal
years.
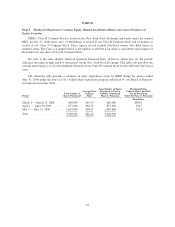
The following table presents a summary of share repurchases made by NIKE during the quarter ended
May 31, 2006 under the four-year $1.5 billion share repurchase program authorized by our Board of Directors
and announced in June 2004.
Period
Total Number of
Shares Purchased
Average Price
Paid per
Share
Total Number of Shares
Purchased as Part of
Publicly Announced
Plans or Programs
Maximum Dollar
Value of Shares that May
Yet Be Purchased
Under the Plans or Programs
(In millions)
March 1 — March 31, 2006 .... 660,000 $85.59 660,000 $369.0
April 1 — April 30, 2006 ...... 873,300 $82.76 873,300 296.7
May 1 — May 31, 2006 ....... 1,667,600 $80.42 1,667,600 162.6
Total ...................... 3,200,900 $82.12 3,200,900
18