Nike 2006 Annual Report Download - page 23
Download and view the complete annual report
Please find page 23 of the 2006 Nike annual report below. You can navigate through the pages in the report by either clicking on the pages listed below, or by using the keyword search tool below to find specific information within the annual report.-
 1
1 -
2
-
3
-
4
-
5
-
6
-
7
-
8
-
9
-
10
-
11
-
12
-
 13
13 -
 14
14 -
 15
15 -
 16
16 -
 17
17 -
 18
18 -
 19
19 -
 20
20 -
 21
21 -
 22
22 -
 23
23 -
 24
24 -
 25
25 -
 26
26 -
 27
27 -
 28
28 -
 29
29 -
 30
30 -
 31
31 -
 32
32 -
 33
33 -
34
-
35
-
36
-
37
-
38
-
39
-
40
-
41
-
42
-
43
-
44
-
45
-
46
-
47
-
48
-
49
-
50
-
51
-
52
-
53
-
54
-
55
-
56
-
57
-
58
-
59
-
60
-
61
-
62
-
63
-
64
-
65
-
66
-
67
-
68
-
69
-
70
-
71
-
72
-
73
-
74
-
75
-
76
-
77
-
78
-
79
-
80
-
81
-
82
-
83
-
84
 |
 |

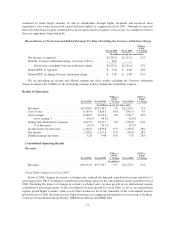
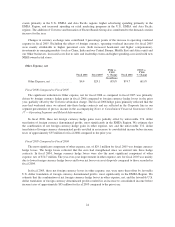
Fiscal 2005 Compared to Fiscal 2004
In fiscal 2005, 3 percentage points of the revenue growth were attributed to changes in currency exchange
rates, primarily the stronger euro. Excluding the impact of changes in foreign currency, revenue growth in our
international regions contributed 4 percentage points to the consolidated revenue growth, as all of our
international regions posted higher revenues. The U.S. Region contributed 3 percentage points of the
consolidated revenue growth for fiscal 2005. Sales in our Other businesses drove the remainder of the
improvement of consolidated revenue growth for fiscal 2005. Converse was acquired at the beginning of the
second quarter of fiscal 2004. The comparison of a full year of Converse results in fiscal 2005 versus a partial
year in fiscal 2004 contributed 1 percentage point to the consolidated revenue growth. See the accompanying
Notes to Consolidated Financial Statements (Note 15 — Acquisitions) for additional information related to the
acquisition.
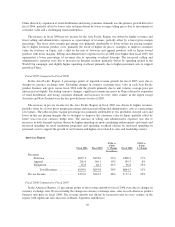
Gross Margin
2006 2005
FY06 vs.
FY05
Change 2004
FY05 vs.
FY04
Change
(In millions)
Gross Margin ....................... $6,587.0 $6,115.4 8% $5,251.7 16%
Gross Margin % ................. 44.0% 44.5% (50) bps 42.9% 160 bps
Fiscal 2006 Compared to Fiscal 2005
During fiscal 2006, our consolidated gross margin percentage declined 50 basis points versus the prior year.
The primary factors contributing to the reduced gross margin percentage for fiscal 2006 were as follows:
(1) Lower footwear in-line net pricing margins in the U.S., Europe, Middle East and Africa
(“EMEA”) and Asia Pacific regions. The lower footwear in-line net pricing margins were due to
higher product costs, primarily the result of higher oil prices; additional costs incurred to meet
strong footwear unit demand in the U.S.; higher sales incentives in EMEA and Asia Pacific;
strategies to improve consumer value in EMEA and Japan; and a shift in the mix of footwear
models sold towards models with lower margins within EMEA and Japan.
(2) A shift in the mix of revenues reported from our operating segments towards regions and
subsidiaries with lower margins.
The factors driving a reduced gross margin percentage were partially offset by:
(1) Year-over-year currency hedge rate improvements, primarily for the euro.
(2) Improved gross margin percentages in our Other businesses driven by improvements at Converse,
Hurley and NIKE Golf.
Fiscal 2005 Compared to Fiscal 2004
During fiscal 2005, our consolidated gross margin percentage improved 160 basis points versus the prior
year. The primary factors contributing to the improved gross margin percentage for fiscal 2005 were as follows:
(1) Higher gross margins in our international regions, driven primarily by our EMEA Region. This
improvement was driven by changes in currency hedge rates, primarily the euro, partially offset
by lower in-line net pricing margins and a higher percentage of less profitable closeout sales (non-
current product offerings) in our EMEA and Asia Pacific regions. The lower in-line net pricing
margins were due to strategies to improve consumer value. The increased levels of closeout sales
and lower closeout pricing were the result of the liquidation of higher footwear and apparel
closeout inventories in our EMEA and Asia Pacific regions.
22