Nike 2006 Annual Report Download - page 70
Download and view the complete annual report
Please find page 70 of the 2006 Nike annual report below. You can navigate through the pages in the report by either clicking on the pages listed below, or by using the keyword search tool below to find specific information within the annual report.-
 1
1 -
2
-
3
-
4
-
5
-
6
-
7
-
8
-
9
-
10
-
11
-
12
-
13
-
14
-
15
-
16
-
17
-
18
-
19
-
20
-
21
-
22
-
23
-
24
-
25
-
26
-
27
-
28
-
29
-
30
-
31
-
32
-
33
-
34
-
35
-
36
-
37
-
38
-
39
-
40
-
41
-
42
-
43
-
44
-
45
-
46
-
47
-
48
-
49
-
50
-
51
-
52
-
53
-
54
-
55
-
56
-
57
-
58
-
59
-
 60
60 -
 61
61 -
 62
62 -
 63
63 -
 64
64 -
 65
65 -
 66
66 -
 67
67 -
 68
68 -
 69
69 -
 70
70 -
 71
71 -
 72
72 -
 73
73 -
 74
74 -
 75
75 -
 76
76 -
 77
77 -
 78
78 -
 79
79 -
 80
80 -
81
-
82
-
83
-
84
 |
 |

NIKE, INC.
NOTES TO CONSOLIDATED FINANCIAL STATEMENTS — (Continued)
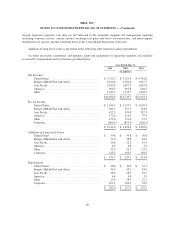
income represent corporate costs that are not allocated to the operating segments for management reporting
including corporate activity, certain currency exchange rate gains and losses on transactions, and intercompany
eliminations for specific income statement items in the Consolidated Statements of Income.
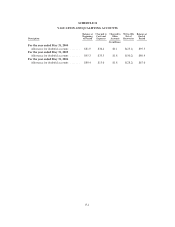
Additions to long-lived assets as presented in the following table represent capital expenditures.
Accounts receivable, inventories and property, plant and equipment for operating segments are regularly
reviewed by management and are therefore provided below.
Year Ended May 31,
2006 2005 2004
(In millions)
Net Revenue
United States ................................... $ 5,722.5 $ 5,129.3 $ 4,781.8
Europe, Middle East and Africa .................... 4,326.6 4,281.6 3,827.7
Asia Pacific .................................... 2,053.8 1,897.3 1,610.8
Americas ...................................... 904.9 695.8 604.5
Other ......................................... 1,947.1 1,735.7 1,428.3
$14,954.9 $13,739.7 $12,253.1
Pre-tax Income
United States ................................... $ 1,244.5 $ 1,127.9 $ 1,007.3
Europe, Middle East and Africa .................... 960.7 917.5 744.0
Asia Pacific .................................... 412.5 399.8 352.3
Americas ...................................... 172.6 116.5 97.4
Other ......................................... 151.6 151.4 75.3
Corporate ...................................... (800.3) (853.3) (826.3)
$ 2,141.6 $ 1,859.8 $ 1,450.0
Additions to Long-lived Assets
United States ................................... $ 59.8 $ 54.8 $ 30.8
Europe, Middle East and Africa .................... 73.6 38.8 28.9
Asia Pacific .................................... 16.8 22.0 19.9
Americas ...................................... 6.9 6.8 5.8
Other ......................................... 33.2 31.3 25.2
Corporate ...................................... 143.4 103.4 104.2
$ 333.7 $ 257.1 $ 214.8
Depreciation
United States ................................... $ 68.8 $ 49.0 $ 52.1
Europe, Middle East and Africa .................... 46.9 45.2 43.6
Asia Pacific .................................... 28.4 28.3 38.5
Americas ...................................... 6.4 4.0 3.9
Other ......................................... 29.0 28.5 22.2
Corporate ...................................... 102.5 102.2 94.9
$ 282.0 $ 257.2 $ 255.2
69