Nike 2006 Annual Report Download - page 27
Download and view the complete annual report
Please find page 27 of the 2006 Nike annual report below. You can navigate through the pages in the report by either clicking on the pages listed below, or by using the keyword search tool below to find specific information within the annual report.-
 1
1 -
2
-
3
-
4
-
5
-
6
-
7
-
8
-
9
-
10
-
11
-
12
-
13
-
14
-
15
-
16
-
 17
17 -
 18
18 -
 19
19 -
 20
20 -
 21
21 -
 22
22 -
 23
23 -
 24
24 -
 25
25 -
 26
26 -
 27
27 -
 28
28 -
 29
29 -
 30
30 -
 31
31 -
 32
32 -
 33
33 -
 34
34 -
 35
35 -
 36
36 -
 37
37 -
38
-
39
-
40
-
41
-
42
-
43
-
44
-
45
-
46
-
47
-
48
-
49
-
50
-
51
-
52
-
53
-
54
-
55
-
56
-
57
-
58
-
59
-
60
-
61
-
62
-
63
-
64
-
65
-
66
-
67
-
68
-
69
-
70
-
71
-
72
-
73
-
74
-
75
-
76
-
77
-
78
-
79
-
80
-
81
-
82
-
83
-
84
 |
 |

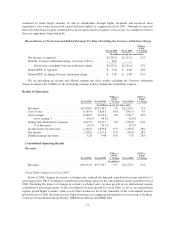
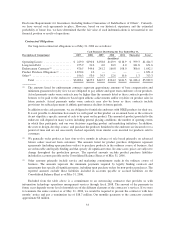
Operating Segments
The breakdown of revenues follows:
Fiscal 2006 Fiscal 2005
FY06 vs.
FY05
% Change Fiscal 2004
FY05 vs.
FY04
% Change
(In millions)
U.S. Region
Footwear .................. $ 3,832.2 $ 3,358.2 14% $ 3,070.4 9%
Apparel ................... 1,591.6 1,457.7 9% 1,433.5 2%
Equipment ................ 298.7 313.4 (5)% 277.9 13%
Total U.S ............. 5,722.5 5,129.3 12% 4,781.8 7%
EMEA Region
Footwear .................. 2,454.3 2,500.0 (2)% 2,232.2 12%
Apparel ................... 1,559.0 1,497.1 4% 1,333.8 12%
Equipment ................ 313.3 284.5 10% 261.7 9%
Total EMEA ........... 4,326.6 4,281.6 1% 3,827.7 12%
Asia Pacific Region
Footwear .................. 1,044.1 962.9 8% 855.3 13%
Apparel ................... 815.6 755.5 8% 612.3 23%
Equipment ................ 194.1 178.9 8% 143.2 25%
Total Asia Pacific ....... 2,053.8 1,897.3 8% 1,610.8 18%
Americas Region
Footwear .................. 635.3 478.6 33% 408.2 17%
Apparel ................... 201.8 169.1 19% 159.5 6%
Equipment ................ 67.8 48.1 41% 36.8 31%
Total Americas ......... 904.9 695.8 30% 604.5 15%
13,007.8 12,004.0 8% 10,824.8 11%
Other ......................... 1,947.1 1,735.7 12% 1,428.3 22%
Total Revenues ................. $14,954.9 $13,739.7 9% $12,253.1 12%
The breakdown of income before income taxes (“pre-tax income”) follows:
Fiscal 2006 Fiscal 2005
FY06 vs.
FY05
% Change Fiscal 2004
FY05 vs.
FY04
% Change
(In millions)
U.S. Region ..................... $1,244.5 $1,127.9 10% $1,007.3 12%
EMEA Region .................. 960.7 917.5 5% 744.0 23%
Asia Pacific Region .............. 412.5 399.8 3% 352.3 13%
Americas Region ................ 172.6 116.5 48% 97.4 20%
Other .......................... 151.6 151.4 —% 75.3 101%
Corporate ...................... (800.3) (853.3) 6% (826.3) (3)%
Total Pre-tax Income ............. $2,141.6 $1,859.8 15% $1,450.0 28%
** Certain prior year amounts have been reclassified to conform to fiscal year 2006 presentation. These
changes had no impact on previously reported results of operations or shareholders’ equity.
26