Nike 2006 Annual Report Download - page 21
Download and view the complete annual report
Please find page 21 of the 2006 Nike annual report below. You can navigate through the pages in the report by either clicking on the pages listed below, or by using the keyword search tool below to find specific information within the annual report.-
 1
1 -
2
-
3
-
4
-
5
-
6
-
7
-
8
-
9
-
10
-
 11
11 -
 12
12 -
 13
13 -
 14
14 -
 15
15 -
 16
16 -
 17
17 -
 18
18 -
 19
19 -
 20
20 -
 21
21 -
 22
22 -
 23
23 -
 24
24 -
 25
25 -
 26
26 -
 27
27 -
 28
28 -
 29
29 -
 30
30 -
 31
31 -
32
-
33
-
34
-
35
-
36
-
37
-
38
-
39
-
40
-
41
-
42
-
43
-
44
-
45
-
46
-
47
-
48
-
49
-
50
-
51
-
52
-
53
-
54
-
55
-
56
-
57
-
58
-
59
-
60
-
61
-
62
-
63
-
64
-
65
-
66
-
67
-
68
-
69
-
70
-
71
-
72
-
73
-
74
-
75
-
76
-
77
-
78
-
79
-
80
-
81
-
82
-
83
-
84
 |
 |

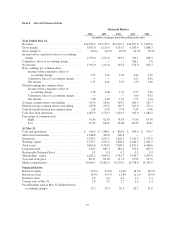
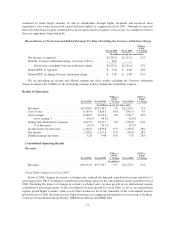
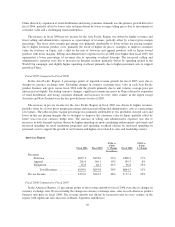
Selected Quarterly Financial Data
1st Quarter 2nd Quarter 3rd Quarter 4th Quarter
2006 2005 2006 2005 2006 2005 2006 2005
(Unaudited)
(In millions, except per share data and financial ratios)
Revenues .................................. $3,862.0 $3,561.8 $3,474.7 $3,148.3 $3,612.8 $3,308.2 $4,005.4 $3,721.4
Gross margin ............................... 1,748.1 1,585.8 1,511.4 1,388.1 1,574.1 1,458.8 1,753.4 1,682.7
Gross margin % ............................. 45.3% 44.5% 43.5% 44.1% 43.6% 44.1% 43.8% 45.2%
Net income ................................ 432.3 326.8 301.1 261.9 325.8 273.4 332.8 349.5
Basic earnings per common share ............... 1.66 1.24 1.16 0.99 1.26 1.04 1.29 1.34
Diluted earnings per common share ............. 1.61 1.21 1.14 0.97 1.24 1.01 1.27 1.30
Average common shares outstanding ............ 260.9 262.7 259.0 263.3 258.9 263.3 257.2 261.1
Diluted average common shares outstanding ...... 268.6 269.8 263.7 271.1 263.4 271.7 261.4 268.5
Cash dividends declared per common share ....... 0.25 0.20 0.31 0.25 0.31 0.25 0.31 0.25
Price range of common stock
High.................................... 90.93 77.34 88.55 87.80 91.54 92.43 88.04 88.52
Low .................................... 77.36 68.61 76.53 74.52 80.60 82.60 77.39 75.10
Item 7. Management’s Discussion and Analysis of Financial Condition and Results of Operations
Overview
NIKE designs, develops and markets high quality footwear, apparel, equipment and accessory products
worldwide. We are the largest seller of athletic footwear and athletic apparel in the world and sell our products
primarily through a combination of retail accounts, NIKE-owned retail stores, independent distributors and
licensees, in the United States and over 160 countries worldwide. Our goal is to deliver value to our shareholders
by building a profitable portfolio of global footwear, apparel, equipment and accessories brands. Our strategy for
building this portfolio is focused in four key areas:
• Deepening our relationship with consumers;
• Delivering superior, innovative products to the marketplace;
• Making our supply chain a competitive advantage, through operational discipline and excellence; and
• Accelerating growth through focused execution.
By executing this strategy, we aim to deliver the following long-term financial goals:
• High single digit revenue growth;
• Mid-teens earnings per share growth;
• Increased return on invested capital and accelerated cash flows; and
• Consistent results through effective management of our diversified portfolio of businesses.
In fiscal 2006, we met most of these financial goals. Our revenues grew 9% to $15 billion, net income grew
15% to $1.4 billion, and we delivered diluted earnings per share of $5.28, an 18% increase versus fiscal 2005.
These reported results included a $51.9 million charge related to an unfavorable arbitration ruling involving our
Converse subsidiary (see Note 5 — Accrued Liabilities in the accompanying Notes to Consolidated Financial
Statements for more information on the Converse arbitration charge). Excluding this charge, our net income grew
17% and we delivered diluted earnings per share of $5.39, a 20% increase versus fiscal 2005. For fiscal 2006, our
consolidated gross margin percentage decreased 50 basis points to 44.0% primarily due to lower in-line net
pricing margins (net revenue for current product offerings minus product costs) partially offset by improvements
in year-over-year currency hedge rates. The decline in the gross margin percentage and the Converse arbitration
charge were more than offset by 80 basis points of selling and administrative expense leverage (due entirely to
slowing the growth of operating overhead spending), and higher interest income resulting in a higher pre-tax
income margin in fiscal 2006 than in fiscal 2005. In addition, we increased free cash flow from operations and
20