Nike 2006 Annual Report Download - page 22
Download and view the complete annual report
Please find page 22 of the 2006 Nike annual report below. You can navigate through the pages in the report by either clicking on the pages listed below, or by using the keyword search tool below to find specific information within the annual report.-
 1
1 -
2
-
3
-
4
-
5
-
6
-
7
-
8
-
9
-
10
-
11
-
 12
12 -
 13
13 -
 14
14 -
 15
15 -
 16
16 -
 17
17 -
 18
18 -
 19
19 -
 20
20 -
 21
21 -
 22
22 -
 23
23 -
 24
24 -
 25
25 -
 26
26 -
 27
27 -
 28
28 -
 29
29 -
 30
30 -
 31
31 -
 32
32 -
33
-
34
-
35
-
36
-
37
-
38
-
39
-
40
-
41
-
42
-
43
-
44
-
45
-
46
-
47
-
48
-
49
-
50
-
51
-
52
-
53
-
54
-
55
-
56
-
57
-
58
-
59
-
60
-
61
-
62
-
63
-
64
-
65
-
66
-
67
-
68
-
69
-
70
-
71
-
72
-
73
-
74
-
75
-
76
-
77
-
78
-
79
-
80
-
81
-
82
-
83
-
84
 |
 |

continued to return larger amounts of cash to shareholders through higher dividends and increased share
repurchases. Our return on invested capital declined slightly as compared to fiscal 2005. Although we may not
meet all of the financial goals outlined above in any particular fiscal quarter or fiscal year, we continue to believe
these are appropriate long-term goals.
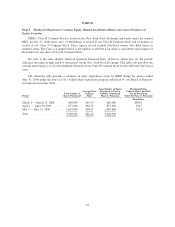
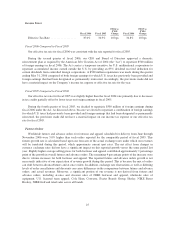
Reconciliation of Net Income and Diluted Earnings Per Share Excluding the Converse Arbitration Charge
Fiscal 2006 Fiscal 2005
FY06 vs.
FY05
% Change
(In millions, except per share data)
Net income, as reported ................................ $1,392.0 $1,211.6 15%
Exclude: Converse arbitration charge, net of tax of $21.1 ...... 30.8 —
Net income, excluding Converse arbitration charge ...... $1,422.8 $1,211.6 17%
Diluted EPS, as reported ............................... $ 5.28 $ 4.48 18%
Diluted EPS, excluding Converse arbitration charge .......... $ 5.39 $ 4.48 20%
We are providing net income and diluted earnings per share results excluding the Converse arbitration
charge to enhance the visibility of the underlying earnings trend excluding this identifiable expense.
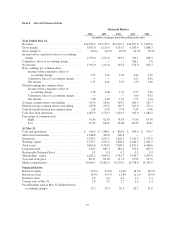
Results of Operations
Fiscal 2006 Fiscal 2005
FY06 vs.
FY05
% Change Fiscal 2004
FY05 vs.
FY04
% Change
(In millions, except per share data)
Revenues .......................... $14,954.9 $13,739.7 9% $12,253.1 12%
Cost of sales ........................ 8,367.9 7,624.3 10% 7,001.4 9%
Gross margin ....................... 6,587.0 6,115.4 8% 5,251.7 16%
Gross margin % ................. 44.0% 44.5% 42.9%
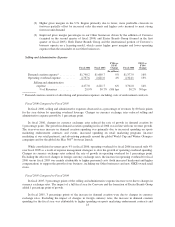
Selling and administrative expense ...... 4,477.8 4,221.7 6% 3,702.0 14%
% of Revenues .................. 29.9% 30.7% 30.2%
Income before income taxes ............ 2,141.6 1,859.8 15% 1,450.0 28%
Net income ......................... 1,392.0 1,211.6 15% 945.6 28%
Diluted earnings per share ............. 5.28 4.48 18% 3.51 28%
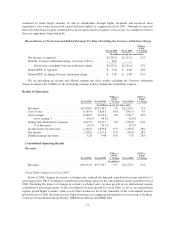
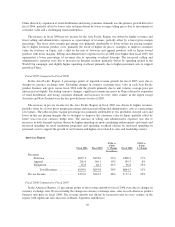
Consolidated Operating Results
Revenues
Fiscal 2006 Fiscal 2005
FY06 vs.
FY05
% Change Fiscal 2004
FY05 vs.
FY04
% Change
(In millions)
Revenues .......................... $14,954.9 $13,739.7 9% $12,253.1 12%
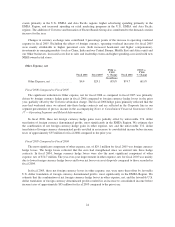
Fiscal 2006 Compared to Fiscal 2005
In fiscal 2006, changes in currency exchange rates reduced the reported consolidated revenue growth by 1
percentage point. The U.S. Region contributed 4 percentage points of the consolidated revenue growth for fiscal
2006. Excluding the impact of changes in currency exchange rates, revenue growth in our international regions
contributed 4 percentage points of the consolidated revenue growth for fiscal 2006, as all of our international
regions posted higher revenues. Sales in our Other businesses drove the remainder of the consolidated revenue
growth for fiscal 2006. Revenues for our Other businesses are comprised substantially of results from Cole Haan,
Converse, Exeter Brands Group, Hurley, NIKE Bauer Hockey and NIKE Golf.
21