Nike 2006 Annual Report Download - page 31
Download and view the complete annual report
Please find page 31 of the 2006 Nike annual report below. You can navigate through the pages in the report by either clicking on the pages listed below, or by using the keyword search tool below to find specific information within the annual report.-
 1
1 -
2
-
3
-
4
-
5
-
6
-
7
-
8
-
9
-
10
-
11
-
12
-
13
-
14
-
15
-
16
-
17
-
18
-
19
-
20
-
 21
21 -
 22
22 -
 23
23 -
 24
24 -
 25
25 -
 26
26 -
 27
27 -
 28
28 -
 29
29 -
 30
30 -
 31
31 -
 32
32 -
 33
33 -
 34
34 -
 35
35 -
 36
36 -
 37
37 -
 38
38 -
 39
39 -
 40
40 -
 41
41 -
42
-
43
-
44
-
45
-
46
-
47
-
48
-
49
-
50
-
51
-
52
-
53
-
54
-
55
-
56
-
57
-
58
-
59
-
60
-
61
-
62
-
63
-
64
-
65
-
66
-
67
-
68
-
69
-
70
-
71
-
72
-
73
-
74
-
75
-
76
-
77
-
78
-
79
-
80
-
81
-
82
-
83
-
84
 |
 |

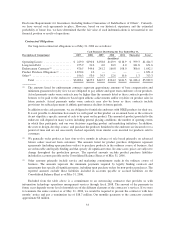
China (driven by expansion of retail distribution and strong consumer demand) was the primary growth driver for
fiscal 2006, partially offset by lower sales in Japan driven by lower average selling prices due to investments in
consumer value and a challenging retail marketplace.
The increase in fiscal 2006 pre-tax income for the Asia Pacific Region was driven by higher revenues and
lower selling and administrative expenses as a percentage of revenues, partially offset by a lower gross margin
percentage. The lower gross margin percentage was primarily attributable to lower in-line net pricing margins
due to higher footwear product costs, primarily the result of higher oil prices; strategies to improve consumer
value for footwear in Japan; and a shift in the mix of footwear and apparel products sold in Japan toward
products with lower margins. Selling and administrative expenses in fiscal 2006 were higher than fiscal 2005, but
represented a lower percentage of revenues due to operating overhead leverage. The increased selling and
administrative expenses were due to increases in demand creation, primarily driven by spending related to the
World Cup campaign, and slightly higher operating overhead, primarily due to higher personnel costs to support
growth in China.
Fiscal 2005 Compared to Fiscal 2004
In the Asia Pacific Region, 4 percentage points of reported revenue growth for fiscal 2005 were due to
changes in currency exchange rates. Excluding changes in currency exchange rates, sales in each Asia Pacific
product business unit grew versus fiscal 2004 with the growth primarily due to unit volume; average price per
unit increased slightly. Excluding currency changes, significant revenue increases in China (driven by expansion
of retail distribution and strong consumer demand) and increases in every other country in the region except
Australia and New Zealand were the key growth drivers for fiscal 2005.
The increase in pre-tax income for the Asia Pacific Region in fiscal 2005 was driven by higher revenues,
partially offset by a lower gross margin percentage and increased selling and administrative costs as a percentage
of revenues. The reduced gross margin percentage was primarily attributable to less profitable closeout sales and
lower in-line net pricing margins due to strategies to improve the consumer value in Japan, partially offset by
better year-over-year currency hedge rates. The increase in selling and administrative expenses was due to
increases in both demand creation (driven by higher spending on sports marketing endorsements and events and
increased spending on retail marketing programs) and operating overhead (driven by increased spending on
personnel costs to support the growth of our business and higher costs related to sales and leadership events).
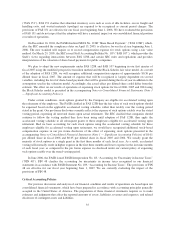
Americas Region
Fiscal 2006 Fiscal 2005
FY06 vs.
FY05
% Change Fiscal 2004
FY05 vs.
FY04
% Change
(In millions)
Revenues
Footwear ................... $635.3 $478.6 33% $408.2 17%
Apparel .................... 201.8 169.1 19% 159.5 6%
Equipment .................. 67.8 48.1 41% 36.8 31%
Total Revenues .......... $904.9 $695.8 30% $604.5 15%
Pre-tax Income .................. $172.6 $116.5 48% $ 97.4 20%
Fiscal 2006 Compared to Fiscal 2005
In the Americas Region, 11 percentage points of the revenue growth for fiscal 2006 were due to changes in
currency exchange rates. Even excluding the changes in currency exchange rates, sales in each Americas product
business unit grew in fiscal 2006. The revenue growth was driven by increased sales in every country in the
region, with significant sales increases in Brazil, Argentina and Mexico.
30