Nike 2006 Annual Report Download - page 24
Download and view the complete annual report
Please find page 24 of the 2006 Nike annual report below. You can navigate through the pages in the report by either clicking on the pages listed below, or by using the keyword search tool below to find specific information within the annual report.-
 1
1 -
2
-
3
-
4
-
5
-
6
-
7
-
8
-
9
-
10
-
11
-
12
-
13
-
 14
14 -
 15
15 -
 16
16 -
 17
17 -
 18
18 -
 19
19 -
 20
20 -
 21
21 -
 22
22 -
 23
23 -
 24
24 -
 25
25 -
 26
26 -
 27
27 -
 28
28 -
 29
29 -
 30
30 -
 31
31 -
 32
32 -
 33
33 -
 34
34 -
35
-
36
-
37
-
38
-
39
-
40
-
41
-
42
-
43
-
44
-
45
-
46
-
47
-
48
-
49
-
50
-
51
-
52
-
53
-
54
-
55
-
56
-
57
-
58
-
59
-
60
-
61
-
62
-
63
-
64
-
65
-
66
-
67
-
68
-
69
-
70
-
71
-
72
-
73
-
74
-
75
-
76
-
77
-
78
-
79
-
80
-
81
-
82
-
83
-
84
 |
 |

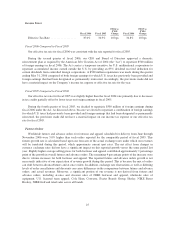
(2) Higher gross margins in the U.S. Region primarily due to fewer, more profitable closeouts in
footwear partially offset by increased sales discounts and higher costs incurred to meet strong
footwear unit demand.
(3) Improved gross margin percentages in our Other businesses driven by the addition of Converse
(acquired in the second quarter of fiscal 2004) and Exeter Brands Group (formed in the first
quarter of fiscal 2005). Both Exeter Brands Group and the international portion of Converse’s
business operate on a licensing model, which carries higher gross margins and lower operating
expenses than the remainder of our Other businesses.
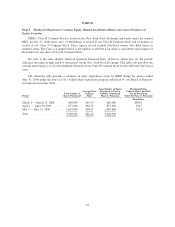
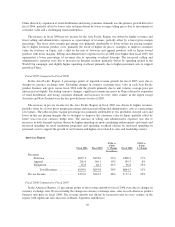
Selling and Administrative Expense
Fiscal 2006 Fiscal 2005
FY06 vs.
FY05
Change Fiscal 2004
FY05 vs.
FY04
Change
(In millions)
Demand creation expense* ........... $1,740.2 $1,600.7 9% $1,377.9 16%
Operating overhead expense .......... 2,737.6 2,621.0 4% 2,324.1 13%
Selling and administrative
expense .................... 4,477.8 4,221.7 6% 3,702.0 14%
% of Revenues ............ 29.9% 30.7% (80) bps 30.2% 50 bps
* Demand creation consists of advertising and promotion expenses, including costs of endorsement contracts.
Fiscal 2006 Compared to Fiscal 2005
In fiscal 2006, selling and administrative expenses decreased as a percentage of revenues by 80 basis points
for the year driven by operating overhead leverage. Changes in currency exchange rates reduced selling and
administrative expense growth by 1 percentage point.
In fiscal 2006, changes in currency exchange rates reduced the rate of growth in demand creation by
1 percentage point. The growth in demand creation spending in fiscal 2006 was in line with our revenue growth.
The year-over-year increase in demand creation spending was primarily due to increased spending on sports
marketing endorsement contracts and events, increased spending on retail marketing programs (in-store
marketing at our retail partners), and advertising primarily around the global World Cup and Winter Olympics
campaigns and for the global Air Max 360™footwear launch.
While consolidated revenues grew 9% in fiscal 2006, operating overhead for fiscal 2006 increased only 4%
over fiscal 2005 as a result of expense management strategies to slow the growth of operating overhead spending.
Changes in currency exchange rates reduced the rate of growth in operating overhead by 1 percentage point.
Excluding the effects of changes in foreign currency exchange rates, the increase in operating overhead for fiscal
2006 versus fiscal 2005 was mainly attributable to higher personnel costs (both increased headcount and higher
compensation) to support the growth of our business, including our Other businesses and new NIKE-owned retail
stores.
Fiscal 2005 Compared to Fiscal 2004
In fiscal 2005, 3 percentage points of the selling and administrative expense increase were due to changes in
currency exchange rates. The impact of a full fiscal year for Converse and the formation of Exeter Brands Group
added 1 percentage point of growth.
In fiscal 2005, 3 percentage points of the increase in demand creation were due to changes in currency
exchange rates. Excluding the impact of changes in foreign currency rates, the increase in demand creation
spending for the fiscal year was attributable to higher spending on sports marketing endorsement contracts and
23