Nike 2006 Annual Report Download - page 30
Download and view the complete annual report
Please find page 30 of the 2006 Nike annual report below. You can navigate through the pages in the report by either clicking on the pages listed below, or by using the keyword search tool below to find specific information within the annual report.-
 1
1 -
2
-
3
-
4
-
5
-
6
-
7
-
8
-
9
-
10
-
11
-
12
-
13
-
14
-
15
-
16
-
17
-
18
-
19
-
 20
20 -
 21
21 -
 22
22 -
 23
23 -
 24
24 -
 25
25 -
 26
26 -
 27
27 -
 28
28 -
 29
29 -
 30
30 -
 31
31 -
 32
32 -
 33
33 -
 34
34 -
 35
35 -
 36
36 -
 37
37 -
 38
38 -
 39
39 -
 40
40 -
41
-
42
-
43
-
44
-
45
-
46
-
47
-
48
-
49
-
50
-
51
-
52
-
53
-
54
-
55
-
56
-
57
-
58
-
59
-
60
-
61
-
62
-
63
-
64
-
65
-
66
-
67
-
68
-
69
-
70
-
71
-
72
-
73
-
74
-
75
-
76
-
77
-
78
-
79
-
80
-
81
-
82
-
83
-
84
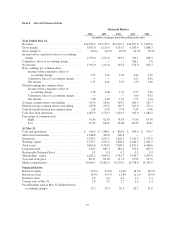
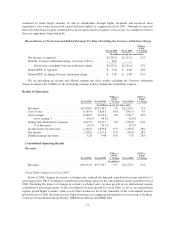
 |
 |

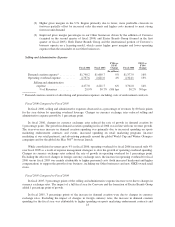
apparel were primarily due to higher product costs and higher sales incentives. Excluding changes in currency
exchange rates, selling and administrative expenses in fiscal 2006 were higher than in fiscal 2005 but represented
a lower percentage of revenues due to operating overhead leverage. Excluding currency changes, the increase in
selling and administrative costs was driven by higher demand creation expenses partially offset by slightly lower
operating overhead expenses. The higher demand creation expenses were primarily due to spending related to the
World Cup campaign and increased spending on retail marketing programs. The slightly lower operating
overhead expenses were due to lower spending on travel and meeting expenses, lower bad debt expense and
slightly lower personnel costs related to our wholesale business, partially offset by increased spending to support
the growth of NIKE-owned retail stores.
Fiscal 2005 Compared to Fiscal 2004
For EMEA, changes in foreign currency exchange rates accounted for 7 percentage points of the reported
revenue growth in fiscal 2005. Excluding the effects of foreign currency, all three product business units grew.
Excluding currency changes, the increase over the prior year was primarily driven by increased unit sales of
footwear, apparel and equipment partially offset by declines in the average prices in each of the product business
units. For fiscal 2005, excluding the changes in currency exchange rates, sales increases in the emerging markets
in our Central Europe, Middle East and Africa unit, along with sales increases in the UK and Italy, drove the
growth. These increases were partially offset by lower sales in France, Germany and Northern Europe.
The increase in pre-tax income in the EMEA region in fiscal 2005 was driven by higher revenues and gross
margin improvements, more than offsetting increased selling and administrative costs as a percentage of
revenues. The improved gross margins were primarily the result of improved year-over-year hedge rates partially
offset by reduced in-line net pricing margins (due to strategies to improve consumer value) and higher, less
profitable closeout sales (the result of the liquidation of higher footwear and apparel closeout inventories). The
increase in selling and administrative expenses was driven by increases in both demand creation and operating
overhead. The increase in demand creation was primarily driven by increased advertising and higher spending on
sports marketing endorsements and events. The increase in operating overhead spending was driven by increased
spending on personnel costs to support the growth of our wholesale business and new NIKE-owned retail stores
and higher costs related to sales and leadership events.
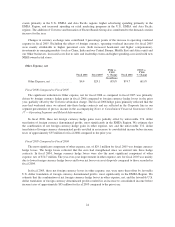
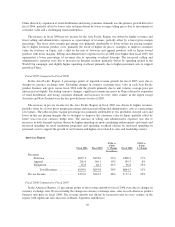
Asia Pacific Region
Fiscal 2006 Fiscal 2005
FY06 vs.
FY05
% Change Fiscal 2004
FY05 vs.
FY04
% Change
(In millions)
Revenues
Footwear ................... $1,044.1 $ 962.9 8% $ 855.3 13%
Apparel .................... 815.6 755.5 8% 612.3 23%
Equipment .................. 194.1 178.9 8% 143.2 25%
Total Revenues .......... $2,053.8 $1,897.3 8% $1,610.8 18%
Pre-tax Income .................. $ 412.5 $ 399.8 3% $ 352.3 13%
Fiscal 2006 Compared to Fiscal 2005
In the Asia Pacific Region, changes in currency exchange rates reduced revenue growth by 1 percentage
point for fiscal 2006. Excluding the changes in currency exchange rates, revenues for each Asia Pacific product
business unit were higher than fiscal 2005. Excluding changes in currency exchange rates, footwear revenues
reflected increased unit sales (driven by increased unit sales across most countries and categories), partially offset
by lower average selling prices (due to strategies to improve consumer value in Japan). The increase in apparel
revenues was driven by increases across sport performance and sport culture categories. Increased revenue in
29