Nike 2006 Annual Report Download - page 20
Download and view the complete annual report
Please find page 20 of the 2006 Nike annual report below. You can navigate through the pages in the report by either clicking on the pages listed below, or by using the keyword search tool below to find specific information within the annual report.-
 1
1 -
2
-
3
-
4
-
5
-
6
-
7
-
8
-
9
-
 10
10 -
 11
11 -
 12
12 -
 13
13 -
 14
14 -
 15
15 -
 16
16 -
 17
17 -
 18
18 -
 19
19 -
 20
20 -
 21
21 -
 22
22 -
 23
23 -
 24
24 -
 25
25 -
 26
26 -
 27
27 -
 28
28 -
 29
29 -
 30
30 -
31
-
32
-
33
-
34
-
35
-
36
-
37
-
38
-
39
-
40
-
41
-
42
-
43
-
44
-
45
-
46
-
47
-
48
-
49
-
50
-
51
-
52
-
53
-
54
-
55
-
56
-
57
-
58
-
59
-
60
-
61
-
62
-
63
-
64
-
65
-
66
-
67
-
68
-
69
-
70
-
71
-
72
-
73
-
74
-
75
-
76
-
77
-
78
-
79
-
80
-
81
-
82
-
83
-
84
 |
 |

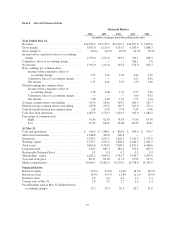
Item 6. Selected Financial Data
Financial History
2006 2005 2004 2003 2002
(In millions, except per share data and financial ratios)
Year Ended May 31,
Revenues ................................. $14,954.9 $13,739.7 $12,253.1 $10,697.0 $ 9,893.0
Gross margin .............................. 6,587.0 6,115.4 5,251.7 4,383.4 3,888.3
Gross margin % ............................ 44.0% 44.5% 42.9% 41.0% 39.3%
Income before cumulative effect of accounting
change ................................. 1,392.0 1,211.6 945.6 740.1 668.3
Cumulative effect of accounting change .........———266.1 5.0
Net income ............................... 1,392.0 1,211.6 945.6 474.0 663.3
Basic earnings per common share:
Income before cumulative effect of
accounting change .................... 5.37 4.61 3.59 2.80 2.50
Cumulative effect of accounting change .....———1.01 0.02
Net income ........................... 5.37 4.61 3.59 1.79 2.48
Diluted earnings per common share:
Income before cumulative effect of
accounting change .................... 5.28 4.48 3.51 2.77 2.46
Cumulative effect of accounting change .....———1.00 0.02
Net income ........................... 5.28 4.48 3.51 1.77 2.44
Average common shares outstanding ........... 259.0 262.6 263.2 264.5 267.7
Diluted average common shares outstanding ..... 263.8 270.3 269.7 267.6 272.2
Cash dividends declared per common share ...... 1.18 0.95 0.74 0.54 0.48
Cash flow from operations ................... 1,667.9 1,570.7 1,518.5 922.0 1,082.2
Price range of common stock
High ................................. 91.54 92.43 78.56 57.85 63.99
Low ................................. 76.53 68.61 49.60 38.53 40.81
At May 31,
Cash and equivalents ........................ $ 954.2 $ 1,388.1 $ 828.0 $ 634.0 $ 575.5
Short-term investments ...................... 1,348.8 436.6 400.8 — —
Inventories ................................ 2,076.7 1,811.1 1,650.2 1,514.9 1,373.8
Working capital ............................ 4,735.7 4,351.9 3,498.1 2,766.5 2,321.5
Total assets ............................... 9,869.6 8,793.6 7,908.7 6,821.1 6,440.0
Long-term debt ............................ 410.7 687.3 682.4 551.6 625.9
Redeemable Preferred Stock .................. 0.3 0.3 0.3 0.3 0.3
Shareholders’ equity ........................ 6,285.2 5,644.2 4,781.7 3,990.7 3,839.0
Year-end stock price ........................ 80.31 82.20 71.15 55.99 53.75
Market capitalization ........................ 20,564.5 21,462.3 18,724.2 14,758.8 14,302.5
Financial Ratios:
Return on equity ........................... 23.3% 23.2% 21.6% 18.9% 18.2%
Return on assets ............................ 14.9% 14.5% 12.8% 11.2% 10.9%
Inventory turns ............................ 4.3 4.4 4.4 4.4 4.3
Current ratio at May 31 ...................... 2.8 3.2 2.7 2.4 2.3
Price/Earnings ratio at May 31 (Diluted before
accounting change) ....................... 15.2 18.3 20.3 20.2 21.8
19