Nike 2006 Annual Report Download - page 33
Download and view the complete annual report
Please find page 33 of the 2006 Nike annual report below. You can navigate through the pages in the report by either clicking on the pages listed below, or by using the keyword search tool below to find specific information within the annual report.-
 1
1 -
2
-
3
-
4
-
5
-
6
-
7
-
8
-
9
-
10
-
11
-
12
-
13
-
14
-
15
-
16
-
17
-
18
-
19
-
20
-
21
-
22
-
 23
23 -
 24
24 -
 25
25 -
 26
26 -
 27
27 -
 28
28 -
 29
29 -
 30
30 -
 31
31 -
 32
32 -
 33
33 -
 34
34 -
 35
35 -
 36
36 -
 37
37 -
 38
38 -
 39
39 -
 40
40 -
 41
41 -
 42
42 -
 43
43 -
44
-
45
-
46
-
47
-
48
-
49
-
50
-
51
-
52
-
53
-
54
-
55
-
56
-
57
-
58
-
59
-
60
-
61
-
62
-
63
-
64
-
65
-
66
-
67
-
68
-
69
-
70
-
71
-
72
-
73
-
74
-
75
-
76
-
77
-
78
-
79
-
80
-
81
-
82
-
83
-
84
 |
 |
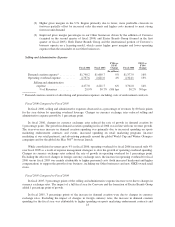
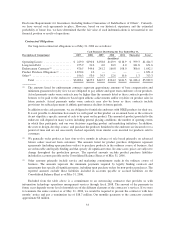
channels serving value-conscious consumers and to operate the business obtained in the acquisition of Official
Starter Properties LLC and Official Starter LLC (collectively “Official Starter”), together drove 12 percentage
points of the Other business revenue increase of 22% over fiscal 2004. The remainder of the increase was driven
by revenue growth at Cole Haan, Hurley and NIKE Golf.
The year-over-year improvement in fiscal 2005 pre-tax income from the Other businesses was driven by the
addition of Converse, improved results from Cole Haan and NIKE Bauer Hockey and the formation of the Exeter
Brands Group.
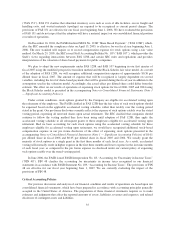
Liquidity and Capital Resources
Fiscal 2006 Cash Flow Activity
Cash provided by operations was $1.7 billion in fiscal 2006, compared to $1.6 billion in fiscal 2005. Our
primary source of operating cash flow was net income of $1.4 billion. For fiscal 2006, our net investment in
working capital increased $43.2 million as compared to an increase of $13.0 million in fiscal 2005. This
increased investment in working capital was largely attributable to a larger increase in inventories and prepaid
expenses and other current assets, partially offset by increases in accounts payable and accrued liabilities. The
increase in inventories reflects higher in-transit inventories (due primarily to growth in reported futures and other
orders, and earlier product ordering compared to last year) and higher inventories to support the expansion of
NIKE-owned retail stores. Prepaid expenses and other current assets increased in fiscal 2006 compared to a
decrease in the prior year, primarily due to the timing of payments, including earlier payments of income taxes in
certain foreign locations. The increase in accounts payable and accrued liabilities is primarily due to the timing of
payments and inventory receipts compared to the prior year.
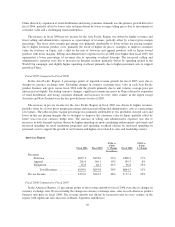
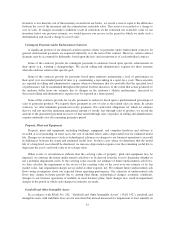
Cash used by investing activities during fiscal 2006 was $1.3 billion, compared to $360.4 million invested
during fiscal 2005. The increase over the prior year was primarily due to a higher net increase in short-term
investments (purchases net of maturities), which increased from $35.3 million in fiscal 2005 to $909.9 million in
fiscal 2006, and increased net additions to property, plant and equipment. The additions to property, plant and
equipment primarily reflect capital expenditures on computer equipment and software (to support both normal
business operations and our supply chain systems upgrade), and continued investment in NIKE-owned retail
stores.
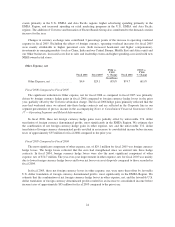
In fiscal 2006, we purchased approximately 9.5 million shares of NIKE’s Class B Common Stock for
$781.2 million. The share repurchases were part of a four-year, $1.5 billion share repurchase program that was
approved by the Board of Directors in June 2004. Since the inception of this program, we have repurchased
16.4 million shares, at a total cost of $1.3 billion. In June 2006, the Board of Directors approved a new four-year,
$3.0 billion share repurchase program, to commence upon completion of the $1.5 billion share repurchase
program. We expect to fund share repurchases from operating cash flow, excess cash, and/or debt. The timing
and the ultimate amount of shares purchased under the programs will be dictated by our capital needs and stock
market conditions.
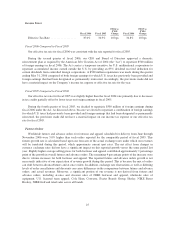
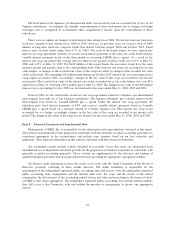
Dividends declared per share of common stock for fiscal 2006 were $1.18, compared to $0.95 in fiscal 2005.
We have paid a dividend every quarter since February 1984. Our current dividend policy is to provide an annual
dividend equal to 20% to 30% of the trailing twelve-months’ earnings per share, paid out on a quarterly basis.
We review our dividend policy from time to time, and based upon current projected earnings and cash flow
requirements, we anticipate continuing to pay a quarterly dividend in the foreseeable future.
Off-Balance Sheet Arrangements
In connection with various contracts and agreements, we provide routine indemnifications relating to the
enforceability of intellectual property rights, coverage for legal issues that arise and other items that fall under
the scope of Financial Accounting Standards Board Interpretation No. 45, “Guarantor’s Accounting and
32