Safeway 2007 Annual Report Download - page 43
Download and view the complete annual report
Please find page 43 of the 2007 Safeway annual report below. You can navigate through the pages in the report by either clicking on the pages listed below, or by using the keyword search tool below to find specific information within the annual report.-
 1
1 -
2
-
3
-
4
-
5
-
6
-
7
-
8
-
9
-
10
-
11
-
12
-
13
-
14
-
15
-
16
-
17
-
18
-
19
-
20
-
21
-
22
-
23
-
24
-
25
-
26
-
27
-
28
-
29
-
30
-
31
-
32
-
 33
33 -
 34
34 -
 35
35 -
 36
36 -
 37
37 -
 38
38 -
 39
39 -
 40
40 -
 41
41 -
 42
42 -
 43
43 -
 44
44 -
 45
45 -
 46
46 -
 47
47 -
 48
48 -
 49
49 -
 50
50 -
 51
51 -
 52
52 -
 53
53 -
54
-
55
-
56
-
57
-
58
-
59
-
60
-
61
-
62
-
63
-
64
-
65
-
66
-
67
-
68
-
69
-
70
-
71
-
72
-
73
-
74
-
75
-
76
-
77
-
78
-
79
-
80
-
81
-
82
-
83
-
84
-
85
-
86
-
87
-
88
-
89
-
90
-
91
-
92
-
93
-
94
-
95
-
96
-
97
-
98
-
99
-
100
-
101
 |
 |

SAFEWAY INC. AND SUBSIDIARIES
Item 7. Management’s Discussion and Analysis of Financial Condition and Results of Operations
Results of Operations
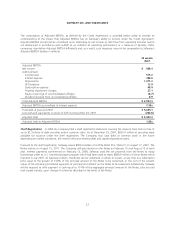
Safeway reported net income of $888.4 million ($1.99 per diluted share) in 2007, $870.6 million ($1.94 per diluted share)
in 2006 and net income of $561.1 million ($1.25 per diluted share) in 2005. Results in fiscal 2006 were affected by a
$62.6 million reduction of income tax expense which is described in this report under the caption “Income Taxes.”
Sales Sales increased 5.2% to $42.3 billion in 2007 from $40.2 billion in 2006 primarily because of Safeway’s
marketing strategy, Lifestyle store execution, increased fuel sales and an increase in the Canadian dollar exchange rate.
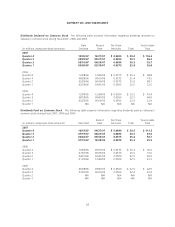
Same-store sales increases for 2007 were as follows:
Comparable-store
sales (includes
replacement stores)
Identical-store sales
(excludes
replacement stores)
Including fuel 4.4% 4.1%
Excluding fuel 3.6% 3.4%
Total sales increased 4.6% to $40.2 billion in 2006 from $38.4 billion in 2005 primarily because of Safeway’s marketing
strategy, Lifestyle store execution and increased fuel sales.
Same-store sales increases for 2006 were as follows:
Comparable-store
sales (includes
replacement stores)
Identical-store sales
(excludes
replacement stores)
Including fuel 4.4% 4.1%
Excluding fuel 3.5% 3.3%
Total sales increased 7.2% to $38.4 billion in 2005 from $35.8 billion in 2004, primarily because of Safeway’s marketing
strategy, Lifestyle store execution and increased fuel sales.
Same-store sales increases for 2005 were as follows:
Comparable-store
sales (includes
replacement stores)
Identical-store sales
(excludes
replacement stores)
Including fuel:
Excluding strike-affected stores 4.6% 4.4%
Including strike-affected stores 5.9% 5.8%
Excluding fuel:
Excluding strike-affected stores 3.0% 2.9%
Including strike-affected stores 4.4% 4.3%
Gross Profit Gross profit represents the portion of sales revenue remaining after deducting the cost of goods sold
during the period, including purchase and distribution costs. These costs include inbound freight charges, purchasing and
receiving costs, warehouse inspection costs, warehousing costs, and other costs associated with Safeway’s distribution
network. Advertising and promotional expenses are also a component of cost of goods sold. Additionally, all vendor
allowances are classified as an element of cost of goods sold.
Gross profit margin was 28.74% of sales in 2007, 28.82% in 2006, and 28.93% in 2005.
21