Safeway 2007 Annual Report Download - page 6
Download and view the complete annual report
Please find page 6 of the 2007 Safeway annual report below. You can navigate through the pages in the report by either clicking on the pages listed below, or by using the keyword search tool below to find specific information within the annual report.-
 1
1 -
 2
2 -
 3
3 -
 4
4 -
 5
5 -
 6
6 -
 7
7 -
 8
8 -
 9
9 -
 10
10 -
 11
11 -
 12
12 -
 13
13 -
 14
14 -
 15
15 -
 16
16 -
 17
17 -
18
-
19
-
20
-
21
-
22
-
23
-
24
-
25
-
26
-
27
-
28
-
29
-
30
-
31
-
32
-
33
-
34
-
35
-
36
-
37
-
38
-
39
-
40
-
41
-
42
-
43
-
44
-
45
-
46
-
47
-
48
-
49
-
50
-
51
-
52
-
53
-
54
-
55
-
56
-
57
-
58
-
59
-
60
-
61
-
62
-
63
-
64
-
65
-
66
-
67
-
68
-
69
-
70
-
71
-
72
-
73
-
74
-
75
-
76
-
77
-
78
-
79
-
80
-
81
-
82
-
83
-
84
-
85
-
86
-
87
-
88
-
89
-
90
-
91
-
92
-
93
-
94
-
95
-
96
-
97
-
98
-
99
-
100
-
101
 |
 |

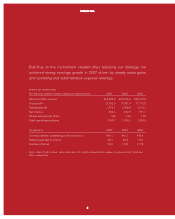
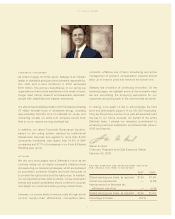
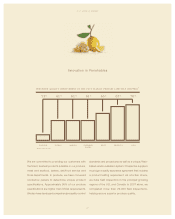
Building on the momentum created after retooling our strategy, we
achieved strong earnings growth in 2007 driven by steady sales gains
and operating and administrative expense leverage.
F I N A N C I A L H I G H L I G H T S
For the year (dollars in millions, except per-share amounts) 2007 2006 2005
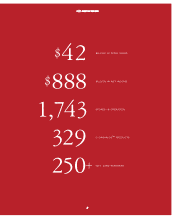
Sales and other revenue $ 42,286.0 $ 40,185.0 $ 38,416.0
Gross profit 12,152.9 11,581.0 11,112.9
Operating profit 1,772.1 1,599.8 1,214.7
Net income 888.4 870.6 561.1
Diluted earnings per share 1.99 1.94 1.25
Cash capital expenditures 1,768.7 1,674.2 1,383.5
At year-end 2007 2006 2005
Common shares outstanding (in millions) (Note 1)
440.1 440.1 449.4
Retail square feet (in millions) 80.3 80.8 81.0
Number of stores
1,743 1,761 1,775
Note 1: Net of 149.2 million, 142.4 million and 130.7 million shares held in treasury at year-end 2007, 2006 and
2005, respectively.
4
S A F E W A Y I N C .