Safeway 2007 Annual Report Download - page 47
Download and view the complete annual report
Please find page 47 of the 2007 Safeway annual report below. You can navigate through the pages in the report by either clicking on the pages listed below, or by using the keyword search tool below to find specific information within the annual report.-
 1
1 -
2
-
3
-
4
-
5
-
6
-
7
-
8
-
9
-
10
-
11
-
12
-
13
-
14
-
15
-
16
-
17
-
18
-
19
-
20
-
21
-
22
-
23
-
24
-
25
-
26
-
27
-
28
-
29
-
30
-
31
-
32
-
33
-
34
-
35
-
36
-
 37
37 -
 38
38 -
 39
39 -
 40
40 -
 41
41 -
 42
42 -
 43
43 -
 44
44 -
 45
45 -
 46
46 -
 47
47 -
 48
48 -
 49
49 -
 50
50 -
 51
51 -
 52
52 -
 53
53 -
 54
54 -
 55
55 -
 56
56 -
 57
57 -
58
-
59
-
60
-
61
-
62
-
63
-
64
-
65
-
66
-
67
-
68
-
69
-
70
-
71
-
72
-
73
-
74
-
75
-
76
-
77
-
78
-
79
-
80
-
81
-
82
-
83
-
84
-
85
-
86
-
87
-
88
-
89
-
90
-
91
-
92
-
93
-
94
-
95
-
96
-
97
-
98
-
99
-
100
-
101
 |
 |
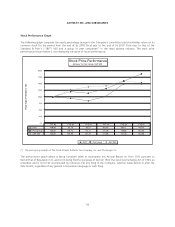
SAFEWAY INC. AND SUBSIDIARIES
Stock-Based Employee Compensation Safeway elected to early adopt SFAS No. 123R in the first quarter of 2005
using the modified prospective method. SFAS No. 123R requires all share-based payments to employees, including grants
of employee stock options, to be recognized in the financial statements as compensation cost based on the fair value on
the date of grant. The Company determines fair value of such awards using the Black-Scholes option pricing model. The
Black-Scholes option pricing model incorporates certain assumptions, such as a risk-free interest rate, expected volatility,
expected dividend yield and expected life of options, in order to arrive at a fair value estimate.
Goodwill Safeway accounts for goodwill in accordance with SFAS No. 142, “Goodwill and Other Intangible Assets.” As
required by SFAS No. 142, Safeway tests for goodwill annually using a two-step approach with extensive use of
accounting judgments and estimates of future operating results. Changes in estimates or the application of alternative
assumptions and definitions could produce significantly different results. The factors that most significantly affect the fair
value calculation are market multiples and estimates of future cash flows. Fair value is determined primarily by the
discounted cash flow method and the guideline company methods.
Income Tax Contingencies The Company is subject to periodic audits by the Internal Revenue Service as well as foreign,
state and local taxing authorities. These audits may challenge certain of the Company’s tax positions such as the timing and
amount of income and deductions and the allocation of taxable income to various tax jurisdictions. Income tax contingencies
are accounted for in accordance with FASB Interpretation No. 48, “Accounting for Uncertainty in Income Taxes” (“FIN 48”),
and may require significant management judgment in estimating final outcomes. Actual results could materially differ from
these estimates and could significantly affect the Company’s effective tax rate and cash flows in future years.
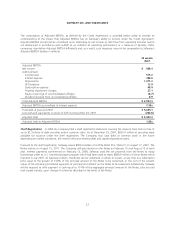
Liquidity and Financial Resources
Net cash flow from operating activities was $2,190.5 million in 2007, $2,175.0 million in 2006 and $1,881.0 million in
2005. Net cash flow from operating activities increased to $2,175.0 million in 2006 compared to $1,881.0 million in
2005 primarily because of higher net income. Net cash flow from operating activities decreased in 2005 primarily because
working capital contributed to cash flow at a lower level than in 2004.
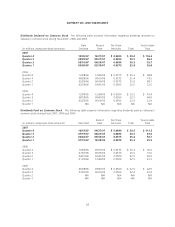
Blackhawk receives a significant portion of the cash inflow from the sale of third-party gift cards late in the fourth quarter
of the year and remits the majority of the cash, less commissions, to the card partners early in the first quarter of the
following year. The sale of gift cards increased cash flow from operating activities by $84.1 million in 2007, $71.1 million
in 2006 and $48.2 million in 2005.
Net cash flow used by investing activities, which consists principally of cash paid for property additions, was $1,686.4
million in 2007, $1,734.7 million in 2006 and $1,313.5 million in 2005. Net cash flow used by investing activities declined
slightly to $1,686.4 million in 2007 from $1,734.7 million in 2006. Cash paid for property additions was greater in 2007
than in 2006. However, proceeds from the sale of property were also greater in 2007. In addition Safeway spent $83.8
million to acquire businesses in 2006. Net cash flow used by investing activities increased to $1,734.7 million in 2006
from $1,313.5 million in 2005 primarily as a result of higher cash paid for property additions, lower proceeds from the
sale of property and the cash used to acquire businesses in 2006.
Capital expenditures increased in 2007, 2006 and 2005 as the Company focused on remodeling its existing stores under
its Lifestyle store format. During 2007 Safeway invested $1.77 billion in capital expenditures. The Company opened 20
new Lifestyle stores, completed 253 Lifestyle remodels and closed 38 stores. The Company also completed 15 other
remodels. In 2006 Safeway opened 17 new Lifestyle stores and completed 276 Lifestyle store remodels. Safeway also
completed eight other remodels. In 2005 the Company opened 21 new Lifestyle stores and completed 293 Lifestyle store
remodels. The Company also completed 22 other remodels. In 2008 the Company expects to spend approximately $1.70
to $1.75 billion in cash capital expenditures and to open approximately 20 to 25 new Lifestyle stores and to remodel
approximately 250 to 255 stores into the Lifestyle format.
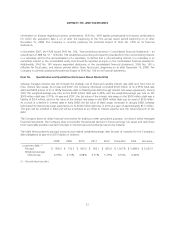
Net cash flow used by financing activities was $454.0 million in 2007, $596.3 million in 2006 and $466.9 million in 2005.
In 2007 Safeway paid down $261.3 million of debt, repurchased $226.1 million of common stock, and paid $111.5
25