Safeway 2007 Annual Report Download - page 85
Download and view the complete annual report
Please find page 85 of the 2007 Safeway annual report below. You can navigate through the pages in the report by either clicking on the pages listed below, or by using the keyword search tool below to find specific information within the annual report.-
 1
1 -
2
-
3
-
4
-
5
-
6
-
7
-
8
-
9
-
10
-
11
-
12
-
13
-
14
-
15
-
16
-
17
-
18
-
19
-
20
-
21
-
22
-
23
-
24
-
25
-
26
-
27
-
28
-
29
-
30
-
31
-
32
-
33
-
34
-
35
-
36
-
37
-
38
-
39
-
40
-
41
-
42
-
43
-
44
-
45
-
46
-
47
-
48
-
49
-
50
-
51
-
52
-
53
-
54
-
55
-
56
-
57
-
58
-
59
-
60
-
61
-
62
-
63
-
64
-
65
-
66
-
67
-
68
-
69
-
70
-
71
-
72
-
73
-
74
-
 75
75 -
 76
76 -
 77
77 -
 78
78 -
 79
79 -
 80
80 -
 81
81 -
 82
82 -
 83
83 -
 84
84 -
 85
85 -
 86
86 -
 87
87 -
 88
88 -
 89
89 -
 90
90 -
 91
91 -
 92
92 -
 93
93 -
 94
94 -
 95
95 -
96
-
97
-
98
-
99
-
100
-
101
 |
 |

SAFEWAY INC. AND SUBSIDIARIES
Notes to Consolidated Financial Statements
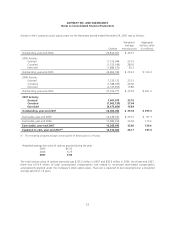
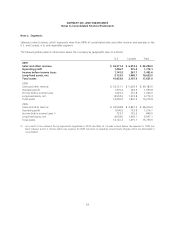
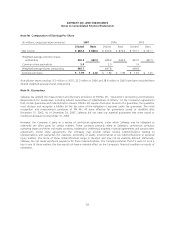
Note L: Segments
Safeway’s retail business, which represents more than 98% of consolidated sales and other revenue and operates in the
U.S. and Canada, is its only reportable segment.
The following table presents information about the Company by geographic area (in millions):
U.S. Canada Total
2007
Sales and other revenue $ 36,271.4 $ 6,014.6 $ 42,286.0
Operating profit 1,496.7 275.4 1,772.1
Income before income taxes 1,141.9 261.7 1,403.6
Long-lived assets, net 9,153.9 1,468.1 10,622.0
Total assets 15,453.6 2,197.4 17,651.0
2006
Sales and other revenue $ 34,721.1 $ 5,463.9 $ 40,185.0
Operating profit 1,370.4 229.4 1,599.8
Income before income taxes 1,029.2 210.8 1,240.0
Long-lived assets, net 8,553.5 1,219.8 9,773.3
Total assets 14,456.9 1,816.9 16,273.8
2005
Sales and other revenue $ 33,568.8 $ 4,847.2 $ 38,416.0
Operating profit 1,090.9 123.8 1,214.7
Income before income taxes (1) 723.7 125.3 849.0
Long-lived assets, net 8,028.0 1,069.1 9,097.1
Total assets 14,141.2 1,615.7 15,756.9
(1) As a result of the Advance Pricing Agreement negotiated in 2005 (see Note H), Canada income before tax expense for 2005 has
been reduced, and U.S. income before tax expense for 2005 has been increased by intercompany charges which are eliminated in
consolidation.
63