Safeway 2007 Annual Report Download - page 44
Download and view the complete annual report
Please find page 44 of the 2007 Safeway annual report below. You can navigate through the pages in the report by either clicking on the pages listed below, or by using the keyword search tool below to find specific information within the annual report.-
 1
1 -
2
-
3
-
4
-
5
-
6
-
7
-
8
-
9
-
10
-
11
-
12
-
13
-
14
-
15
-
16
-
17
-
18
-
19
-
20
-
21
-
22
-
23
-
24
-
25
-
26
-
27
-
28
-
29
-
30
-
31
-
32
-
33
-
 34
34 -
 35
35 -
 36
36 -
 37
37 -
 38
38 -
 39
39 -
 40
40 -
 41
41 -
 42
42 -
 43
43 -
 44
44 -
 45
45 -
 46
46 -
 47
47 -
 48
48 -
 49
49 -
 50
50 -
 51
51 -
 52
52 -
 53
53 -
 54
54 -
55
-
56
-
57
-
58
-
59
-
60
-
61
-
62
-
63
-
64
-
65
-
66
-
67
-
68
-
69
-
70
-
71
-
72
-
73
-
74
-
75
-
76
-
77
-
78
-
79
-
80
-
81
-
82
-
83
-
84
-
85
-
86
-
87
-
88
-
89
-
90
-
91
-
92
-
93
-
94
-
95
-
96
-
97
-
98
-
99
-
100
-
101
 |
 |
SAFEWAY INC. AND SUBSIDIARIES
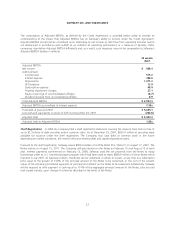
Gross profit decreased 8 basis points to 28.74% of sales in 2007 from 28.82% of sales in 2006. Higher fuel sales reduced
gross profit by 20 basis points. Excluding fuel, gross profit increased 12 basis points primarily because of lower advertising
expense, improved shrink, and benefits from supply-chain initiatives, partly offset by investments in price and higher LIFO
expense. LIFO expense was $13.9 million in 2007 compared to $1.2 million in 2006.
Gross profit decreased 11 basis points to 28.82% of sales in 2006 from 28.93% of sales in 2005. Higher fuel sales
reduced gross profit by 28 basis points. Excluding fuel, gross profit increased 17 basis points, primarily because of
improved shrink, benefits from product-sourcing initiatives and improved product mix, partly offset by investments in
price and increased advertising expense.
The gross profit margin decreased 65 basis points to 28.93% of sales in 2005 from 29.58% in 2004. Higher fuel sales
reduced gross profit by 39 basis points. The remaining decline is due to grand openings of Lifestyle stores, investment in
price, increased advertising expense and higher energy costs.
Vendor allowances totaled $2.5 billion in both 2007 and 2006 and $2.4 billion in 2005. Vendor allowances can be
grouped into the following broad categories: promotional allowances, slotting allowances and contract allowances. All
vendor allowances are classified as an element of cost of goods sold.
Promotional allowances make up approximately three-quarters of all allowances. With promotional allowances, vendors
pay Safeway to promote their product. The promotion may be any combination of a temporary price reduction, a feature
in print ads, a feature in a Safeway circular, or a preferred location in the store. The promotions are typically one to two
weeks long.
Slotting allowances are a small portion of total allowances (typically less than 5% of all allowances). With slotting
allowances, the vendor reimburses Safeway for the cost of placing new product on the shelf. Safeway has no obligation
or commitment to keep the product on the shelf for a minimum period.
Contract allowances make up the remainder of all allowances. Under the typical contract allowance, a vendor pays
Safeway to keep product on the shelf for a minimum period of time or when volume thresholds are achieved.
Operating and Administrative Expense Operating and administrative expense consists primarily of store occupancy
costs and backstage expenses, which, in turn, consist primarily of wages, employee benefits, rent, depreciation and
utilities.
Dominick’s. In February 2007, the Company announced a strategic plan to revitalize its operations at Dominick’s. This
plan included remodeling 20 stores to the Lifestyle format, new store development and closing 14 under-performing
stores in 2007. In the second quarter of 2007, Safeway incurred a store-lease exit charge of $30.3 million ($0.04 per
diluted share) as a result of these closures. While management believes this strategy will improve sales and profitability,
there can be no assurance that Dominick’s will achieve satisfactory operating results in the future.
Randall’s. In the third quarter of 2005, the Company announced a plan to revitalize the Texas market which included
the closure of 26 under-performing stores, a focused Lifestyle remodel program and the introduction of proprietary
products. This resulted in a pre-tax, long-lived asset impairment charge of $54.7 million ($0.08 per diluted share). In the
fourth quarter of 2005, Safeway recorded $55.5 million pre-tax ($0.07 per diluted share) in store exit activities for these
stores.
Gain (Loss) on Property Retirements. Operating and administrative expense included a $42.3 million net gain on
property retirements in 2007, a $17.8 million net gain on property retirements in 2006 and a $13.6 million net loss on
property retirements in 2005. In 2007 the Company sold a Bellevue, Washington distribution center at a gain of $46.6
million and a warehouse in Chicago, Illinois at a gain of $11.2 million. These gains were partly offset by net losses on
other property retirements.
Other Charges. In 2005 the Company incurred $59.4 million before tax ($0.08 per diluted share) in employee buyout
charges, severance and related costs, relating primarily to Dominick’s and Northern California.
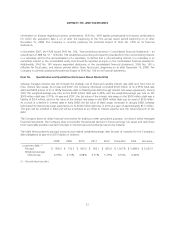
Operating and administrative expense was 24.55% of sales in 2007 compared to 24.84% in 2006 and 25.77% in 2005.
22