Safeway 2007 Annual Report Download - page 69
Download and view the complete annual report
Please find page 69 of the 2007 Safeway annual report below. You can navigate through the pages in the report by either clicking on the pages listed below, or by using the keyword search tool below to find specific information within the annual report.-
 1
1 -
2
-
3
-
4
-
5
-
6
-
7
-
8
-
9
-
10
-
11
-
12
-
13
-
14
-
15
-
16
-
17
-
18
-
19
-
20
-
21
-
22
-
23
-
24
-
25
-
26
-
27
-
28
-
29
-
30
-
31
-
32
-
33
-
34
-
35
-
36
-
37
-
38
-
39
-
40
-
41
-
42
-
43
-
44
-
45
-
46
-
47
-
48
-
49
-
50
-
51
-
52
-
53
-
54
-
55
-
56
-
57
-
58
-
 59
59 -
 60
60 -
 61
61 -
 62
62 -
 63
63 -
 64
64 -
 65
65 -
 66
66 -
 67
67 -
 68
68 -
 69
69 -
 70
70 -
 71
71 -
 72
72 -
 73
73 -
 74
74 -
 75
75 -
 76
76 -
 77
77 -
 78
78 -
 79
79 -
80
-
81
-
82
-
83
-
84
-
85
-
86
-
87
-
88
-
89
-
90
-
91
-
92
-
93
-
94
-
95
-
96
-
97
-
98
-
99
-
100
-
101
 |
 |

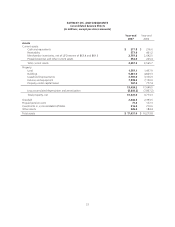
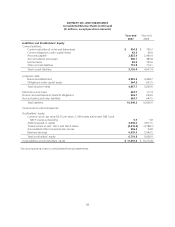
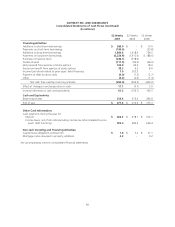
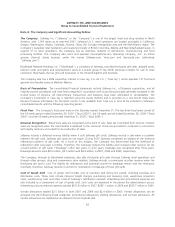
SAFEWAY INC. AND SUBSIDIARIES
Notes to Consolidated Financial Statements
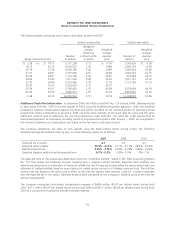
Additionally, SFAS No. 160 requires expanded disclosures in the consolidated financial statements. SFAS No. 160 is
effective for fiscal years, and interim periods within those fiscal years, beginning on or after December 15, 2008. The
Company is currently assessing the potential impact of SFAS No. 160 on its financial statements.
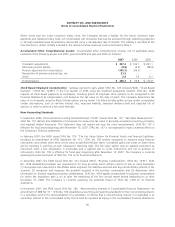
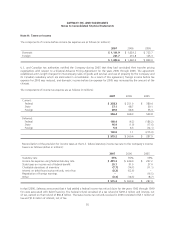
Note B: Goodwill
A summary of changes in Safeway’s goodwill during 2007 and 2006 by geographic area is as follows (in millions):
2007 2006
U.S. Canada Total U.S. Canada Total
Balance – beginning of year $ 2,309.5 $ 84.0 $ 2,393.5 $ 2,317.8 $ 84.6 $ 2,402.4
Acquisition of businesses –– – (7.7) (1) – (7.7)
Other adjustments (0.7) (2) 13.5 (3) 12.8 (0.6) (2) (0.6) (3) (1.2)
Balance – end of year $ 2,308.8 $ 97.5 $ 2,406.3 $ 2,309.5 $ 84.0 $ 2,393.5
(1) Net reduction in goodwill results from the expected utilization of net operating loss carryforwards. See Note H.
(2) Primarily represents revised estimate of pre-acquisition tax accrual.
(3) Represents foreign currency translation adjustments in Canada.
Safeway completed its annual impairment tests in the fourth quarters of 2007, 2006 and 2005. Fair value was
determined based primarily on the discounted cash flow and guideline company methods. As a result of these annual
reviews, Safeway concluded that no impairment charge was required.
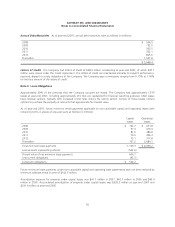
Note C: Store Closing and Impairment Charges
Impairment Write-Downs Safeway recognized impairment charges on the write-down of long-lived assets of $27.1
million in 2007, $39.2 million in 2006 and $78.9 million in 2005. This includes Randall’s impairment charges of $54.7
million in 2005. These charges are included as a component of operating and administrative expense.
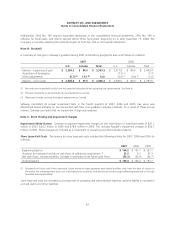
Store Lease Exit Costs The reserve for store lease exit costs includes the following activity for 2007, 2006 and 2005 (in
millions):
2007 2006 2005
Beginning balance $ 164.2 $ 197.7 $ 167.1
Provision for estimated net future cash flows of additional closed stores (1) 31.5 0.1 67.3
Net cash flows, interest accretion, changes in estimates of net future cash flows (35.3) (33.6) (36.7)
Ending balance $ 160.4 $ 164.2 $ 197.7
(1) Estimated net future cash flows represents future minimum lease payments and related ancillary costs from the date of closure to
the end of the remaining lease term, net of estimated cost recoveries that may be achieved through subletting properties or through
favorable lease terminations.
Store lease exit costs are included as a component of operating and administrative expense, and the liability is included in
accrued claims and other liabilities.
47