Safeway 2007 Annual Report Download - page 8
Download and view the complete annual report
Please find page 8 of the 2007 Safeway annual report below. You can navigate through the pages in the report by either clicking on the pages listed below, or by using the keyword search tool below to find specific information within the annual report.-
 1
1 -
 2
2 -
 3
3 -
 4
4 -
 5
5 -
 6
6 -
 7
7 -
 8
8 -
 9
9 -
 10
10 -
 11
11 -
 12
12 -
 13
13 -
 14
14 -
 15
15 -
 16
16 -
 17
17 -
 18
18 -
 19
19 -
20
-
21
-
22
-
23
-
24
-
25
-
26
-
27
-
28
-
29
-
30
-
31
-
32
-
33
-
34
-
35
-
36
-
37
-
38
-
39
-
40
-
41
-
42
-
43
-
44
-
45
-
46
-
47
-
48
-
49
-
50
-
51
-
52
-
53
-
54
-
55
-
56
-
57
-
58
-
59
-
60
-
61
-
62
-
63
-
64
-
65
-
66
-
67
-
68
-
69
-
70
-
71
-
72
-
73
-
74
-
75
-
76
-
77
-
78
-
79
-
80
-
81
-
82
-
83
-
84
-
85
-
86
-
87
-
88
-
89
-
90
-
91
-
92
-
93
-
94
-
95
-
96
-
97
-
98
-
99
-
100
-
101
 |
 |

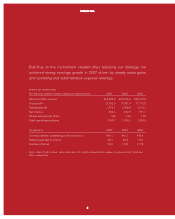
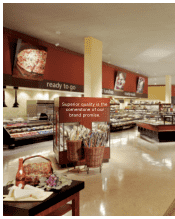
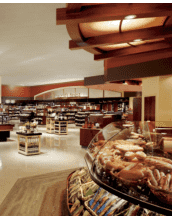
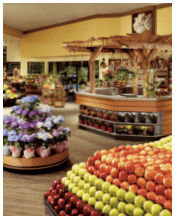
We achieved excellent results again in 2007, posting solid
gains in sales and earnings. Safeway shoppers continued
to be favorably impressed with the unique ambience and
content of our highly successful Lifestyle stores. As of
year-end 2007, we had gained market share in the U.S.
supermarket channel for 12 consecutive quarters.
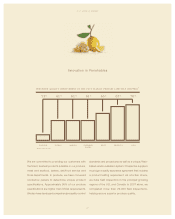
N E T I N C O M E
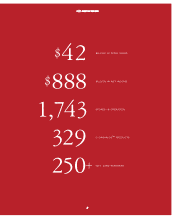
Net income was $888.4 million ($1.99 per diluted share)
in 2007 compared to $870.6 million ($1.94 per diluted
share) in 2006. Various favorable tax items increased
earnings in 2006 by $0.22 per diluted share. Excluding
these items, earnings per share in 2007 increased 15.7%
year over year.1
S A L E S
Total sales rose 5.2% to $42.3 billion in 2007 from $40.2
billion in 2006, mainly due to the continuing success of
our Lifestyle stores, consistent execution of our marketing
strategy, increased fuel sales and a higher Canadian dollar
exchange rate. Excluding fuel, identical-store sales were
up 3.4%.
G R O S S P R O F I T
Gross profit in 2007 decreased 8 basis points to 28.74%
of sales. Higher fuel sales (which have a lower gross
margin) reduced gross profit by 20 basis points. Excluding
fuel, gross profit increased 12 basis points primarily
because of lower advertising expense, less “shrink”
(product loss) and benefits from supply-chain initiatives,
partly offset by investments in price and higher LIFO
expense. LIFO expense was $13.9 million in 2007
compared to $1.2 million in 2006.
O P E R A T I N G A N D A D M I N I S T R A T I V E E X P E N S E
Operating and administrative expense in 2007 decreased
29 basis points to 24.55% of sales. Higher fuel sales
reduced our operating and administrative expense margin
by 16 basis points. The remaining 13 basis point decline
was primarily the result of reduced employee costs as a
percentage of sales as well as larger gains on disposal of
property, partly offset by higher depreciation expense.
I N T E R E S T E X P E N S E
Interest expense in 2007 declined $7.2 million to $388.9 million
despite slightly higher average interest rates, primarily
because average total debt declined.
C A P I T A L S P E N D I N G
Capital investments in 2007 increased to $1.77 billion.
During the year we opened 20 new Lifestyle stores,
completed 253 Lifestyle remodels and closed 38 stores.
With 1,024 Lifestyle stores in operation as of year’s end,
they accounted for 59% of our total store base. In 2008 we
expect to invest up to $1.75 billion in capital expenditures
and open as many as 25 new Lifestyle stores while
completing up to 255 Lifestyle remodels.
We also opened 22 fuel stations adjacent to our stores,
bringing the total at year-end 2007 to 361 stations.
R E T U R N I N G C A S H T O S T O C K H O L D E R S
We returned $337.6 million to stockholders in 2007,
consisting of $111.5 million in the form of dividends and
$226.1 million in stock repurchases. The remaining board
authorization for stock repurchases as of year’s end was
$521.1 million.
Dear Stockholders,
6
S A F E W A Y I N C .