Safeway 2007 Annual Report Download - page 50
Download and view the complete annual report
Please find page 50 of the 2007 Safeway annual report below. You can navigate through the pages in the report by either clicking on the pages listed below, or by using the keyword search tool below to find specific information within the annual report.-
 1
1 -
2
-
3
-
4
-
5
-
6
-
7
-
8
-
9
-
10
-
11
-
12
-
13
-
14
-
15
-
16
-
17
-
18
-
19
-
20
-
21
-
22
-
23
-
24
-
25
-
26
-
27
-
28
-
29
-
30
-
31
-
32
-
33
-
34
-
35
-
36
-
37
-
38
-
39
-
 40
40 -
 41
41 -
 42
42 -
 43
43 -
 44
44 -
 45
45 -
 46
46 -
 47
47 -
 48
48 -
 49
49 -
 50
50 -
 51
51 -
 52
52 -
 53
53 -
 54
54 -
 55
55 -
 56
56 -
 57
57 -
 58
58 -
 59
59 -
 60
60 -
61
-
62
-
63
-
64
-
65
-
66
-
67
-
68
-
69
-
70
-
71
-
72
-
73
-
74
-
75
-
76
-
77
-
78
-
79
-
80
-
81
-
82
-
83
-
84
-
85
-
86
-
87
-
88
-
89
-
90
-
91
-
92
-
93
-
94
-
95
-
96
-
97
-
98
-
99
-
100
-
101
 |
 |

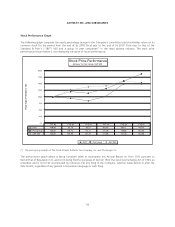
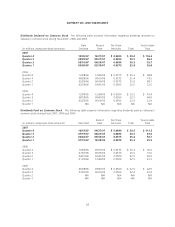
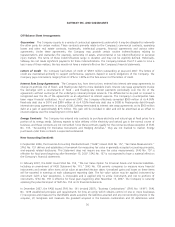
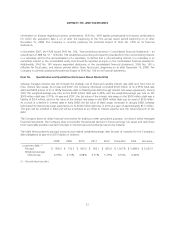
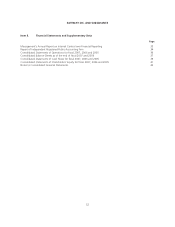
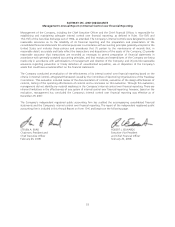
SAFEWAY INC. AND SUBSIDIARIES
Dividends Declared on Common Stock The following table presents information regarding dividends declared on
Safeway’s common stock during fiscal 2007, 2006 and 2005.
(in millions, except per-share amounts)
Date
Declared
Record
Date
Per-Share
Amounts Total
Year-to-date
Total
2007
Quarter 4 12/05/07 12/27/07 $ 0.0690 $ 30.4 $ 116.6
Quarter 3 08/29/07 09/27/07 0.0690 30.5 86.2
Quarter 2 05/16/07 06/29/07 0.0690 30.3 55.7
Quarter 1 03/09/07 03/30/07 0.0575 25.4 25.4
2006
Quarter 4 12/08/06 12/29/06 $ 0.0575 $ 25.3 $ 98.8
Quarter 3 08/28/06 09/13/06 0.0575 25.4 73.5
Quarter 2 05/25/06 06/16/06 0.0575 25.6 48.1
Quarter 1 03/10/06 03/31/06 0.0500 22.5 22.5
2005
Quarter 4 12/09/05 12/30/05 $ 0.0500 $ 22.5 $ 67.4
Quarter 3 08/18/05 09/07/05 0.0500 22.5 44.9
Quarter 2 05/25/05 06/16/05 0.0500 22.4 22.4
Quarter 1 N/A N/A N/A N/A N/A
Dividends Paid on Common Stock The following table presents information regarding dividends paid on Safeway’s
common stock during fiscal 2007, 2006 and 2005.
(in millions, except per-share amounts) Date Paid
Record
Date
Per-Share
Amounts Total
Year-to-date
Total
2007
Quarter 4 10/18/07 09/27/07 $ 0.0690 $ 30.5 $ 111.5
Quarter 3 07/19/07 06/29/07 0.0690 30.3 81.0
Quarter 2 04/20/07 03/30/07 0.0575 25.4 50.7
Quarter 1 01/19/07 12/29/06 0.0575 25.3 25.3
2006
Quarter 4 10/05/06 09/13/06 $ 0.0575 $ 25.4 $ 96.0
Quarter 3 07/07/06 06/16/06 0.0575 25.6 70.6
Quarter 2 04/21/06 03/31/06 0.0500 22.5 45.0
Quarter 1 01/20/06 12/30/05 0.0500 22.5 22.5
2005
Quarter 4 09/28/05 09/07/05 $ 0.0500 $ 22.5 $ 44.9
Quarter 3 07/07/05 06/16/05 0.0500 22.4 22.4
Quarter 2 N/A N/A N/A N/A N/A
Quarter 1 N/A N/A N/A N/A N/A
28