Siemens 2015 Annual Report Download - page 10
Download and view the complete annual report
Please find page 10 of the 2015 Siemens annual report below. You can navigate through the pages in the report by either clicking on the pages listed below, or by using the keyword search tool below to find specific information within the annual report.-
 1
1 -
 2
2 -
 3
3 -
 4
4 -
 5
5 -
 6
6 -
 7
7 -
 8
8 -
 9
9 -
 10
10 -
 11
11 -
 12
12 -
 13
13 -
 14
14 -
 15
15 -
 16
16 -
 17
17 -
 18
18 -
 19
19 -
 20
20 -
 21
21 -
22
-
23
-
24
-
25
-
26
-
27
-
28
-
29
-
30
-
31
-
32
-
33
-
34
-
35
-
36
-
37
-
38
-
39
-
40
-
41
-
42
-
43
-
44
-
45
-
46
-
47
-
48
-
49
-
50
-
51
-
52
-
53
-
54
-
55
-
56
-
57
-
58
-
59
-
60
-
61
-
62
-
63
-
64
-
65
-
66
-
67
-
68
-
69
-
70
-
71
-
72
-
73
-
74
-
75
-
76
-
77
-
78
-
79
-
80
-
81
-
82
-
83
-
84
-
85
-
86
-
87
-
88
-
89
-
90
-
91
-
92
-
93
-
94
-
95
-
96
-
97
-
98
-
99
-
100
-
101
-
102
-
103
-
104
-
105
-
106
-
107
-
108
-
109
-
110
-
111
-
112
-
113
-
114
-
115
-
116
-
117
-
118
-
119
-
120
-
121
-
122
-
123
-
124
-
125
-
126
-
127
-
128
-
129
-
130
-
131
-
132
-
133
-
134
-
135
-
136
-
137
-
138
-
139
-
140
 |
 |

Combined Management Report
A.2.1 Overview
Within One Siemens, we have established a financial frame-
work – for revenue growth, for profitability and capital effi-
ciency, for our capital structure, and for our dividend policy.
Beginning with fiscal we modified our financial frame-
work in the course of organizational changes and due to our
new strategy “Vision ”, as described in the
ANNUAL REPORT
FOR FISCAL 2014.
A.2.2 Revenue growth
Within the framework of One Siemens, we aim to grow our rev-
enue faster than the average weighted revenue growth of our
most relevant competitors. Our primary measure for managing
and controlling our revenue growth is comparable growth,
which excludes currency translation and portfolio effects.
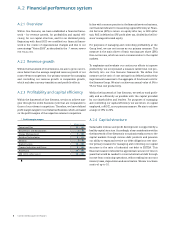
A.2.3 Profitability and capital efficiency
Within the framework of One Siemens, we aim to achieve mar-
gins through the entire business cycle that are comparable to
those of our relevant competitors. Therefore, we have defined
profit margin ranges for our Industrial Business, which are based
on the profit margins of the respective relevant competitors.
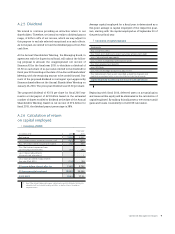
Profit margin ranges
Margin range
Power and Gas 11 – 15%
Wind Power and Renewables 5 – 8%
Energy Management 7 – 10%
Building Technologies 8 – 11%
Mobility 6 – 9%
Digital Factory 14 – 20%
Process Industries and Drives 8 – 12%
Healthcare 15 – 19%
SFS ((ROE) (after taxes)) 15 – 20%
In line with common practice in the financial services business,
our financial indicator for measuring capital efficiency at Finan-
cial Services (SFS) is return on equity after tax, or ROE (after
tax). ROE is defined as SFS’ profit after tax, divided by the Divi-
sions’ average allocated equity.
For purposes of managing and controlling profitability at the
Group level, we use net income as our primary measure. This
measure is the main driver of basic earnings per share (EPS)
from net income, which we use in communication to the capital
markets.
To emphasize and evaluate our continuous efforts to improve
productivity, we incorporated a measure called total cost pro-
ductivity into our One Siemens framework. We define this
measure as the ratio of cost savings from defined productivity
improvement measures to the aggregate of functional costs for
the Siemens Group. We aim to achieve an annual value of % to
% for Total cost productivity.
Within the framework of One Siemens, we seek to work profit-
ably and as efficiently as possible with the capital provided
by our shareholders and lenders. For purposes of managing
and controlling our capital efficiency, we use return on capital
employed, or ROCE, as our primary measure. We aim to achieve
a range of % to %.
A.2.4 Capital structure
Sustainable revenue and profit development is supported by a
healthy capital structure. Accordingly, a key consideration within
the framework of One Siemens is to maintain ready access to the
capital markets through various debt products and preserve
our ability to repay and service our debt obligations over time.
Our primary measure for managing and controlling our capital
structure is the ratio of industrial net debt to EBITDA. This
financial measure indicates the approximate amount of time in
years that would be needed to cover industrial net debt through
income from continuing operations, without taking into account
interest, taxes, depreciation and amortization. We aim to achieve
a ratio of up to ..
A. Financial performance system