Siemens 2015 Annual Report Download - page 16
Download and view the complete annual report
Please find page 16 of the 2015 Siemens annual report below. You can navigate through the pages in the report by either clicking on the pages listed below, or by using the keyword search tool below to find specific information within the annual report.-
 1
1 -
2
-
3
-
4
-
5
-
 6
6 -
 7
7 -
 8
8 -
 9
9 -
 10
10 -
 11
11 -
 12
12 -
 13
13 -
 14
14 -
 15
15 -
 16
16 -
 17
17 -
 18
18 -
 19
19 -
 20
20 -
 21
21 -
 22
22 -
 23
23 -
 24
24 -
 25
25 -
 26
26 -
27
-
28
-
29
-
30
-
31
-
32
-
33
-
34
-
35
-
36
-
37
-
38
-
39
-
40
-
41
-
42
-
43
-
44
-
45
-
46
-
47
-
48
-
49
-
50
-
51
-
52
-
53
-
54
-
55
-
56
-
57
-
58
-
59
-
60
-
61
-
62
-
63
-
64
-
65
-
66
-
67
-
68
-
69
-
70
-
71
-
72
-
73
-
74
-
75
-
76
-
77
-
78
-
79
-
80
-
81
-
82
-
83
-
84
-
85
-
86
-
87
-
88
-
89
-
90
-
91
-
92
-
93
-
94
-
95
-
96
-
97
-
98
-
99
-
100
-
101
-
102
-
103
-
104
-
105
-
106
-
107
-
108
-
109
-
110
-
111
-
112
-
113
-
114
-
115
-
116
-
117
-
118
-
119
-
120
-
121
-
122
-
123
-
124
-
125
-
126
-
127
-
128
-
129
-
130
-
131
-
132
-
133
-
134
-
135
-
136
-
137
-
138
-
139
-
140
 |
 |

Combined Management Report
Centrally managed portfolio activities (CMPA) included a gain
of € . billion on the disposal of Siemens’ stake in BSH Bosch
und Siemens Hausgeräte GmbH (BSH). This was partly offset
by an equity investment loss of € million related to Unify
Holdings B. V. (Unify), an impairment of € million related to
Siemens’ stake in Primetals Technologies Ltd. and losses from
other businesses. For comparison, fiscal included equity
investment income from BSH.
As in the past, income from Siemens Real Estate continues to
be highly dependent on disposals of real estate. In fiscal ,
the disposals of real estate were lower than in the prior-year.
Corporate items were influenced by a number of items, includ-
ing € million in severance charges for corporate reorganiza-
tion of support functions.
The change in Eliminations, Corporate Treasury and other rec-
onciling items included primarily negative effects related to the
change in fair value of interest rate derivatives.
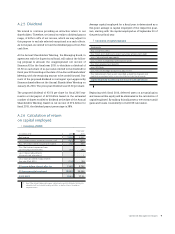
A.3.3 Income
Fiscal year % Change
(in millions of €, earnings per share in €) 2015 2014
Power and Gas 1,426 2,215 (36)%
Wind Power and Renewables 160 6 >200%
Energy Management 570 (86) n / a
Building Technologies 553 511 8%
Mobility 588 532 11%
Digital Factory 1,738 1,681 3%
Process Industries and Drives 536 773 (31)%
Healthcare 2,184 2,072 5%
Industrial Business 7,755 7,703 1%
Profit margin Industrial Business 10.1% 10.6%
Financial Services (SFS) 600 466 29%
Reconciliation to Consolidated Financial Statements (1,138) (862) (32)%
Income from continuing operations before income taxes 7,218 7,306 (1)%
Income tax expenses (1,869) (2,014) 7%
Income from continuing operations 5,349 5,292 1%
Income from discontinued operations, net of income taxes 2,031 215 >200%
Net income 7,380 5,507 34%
Basic earnings per share 8.84 6.37 39%
ROCE 19.6% 17.2%
As a result of the development described for the segments,
Income from continuing operations before income taxes
decreased %. This amount also included higher expenses – as
planned – for selling and research and development, primarily
at Power and Gas and to a lesser degree at Digital Factory and
Healthcare. Severance charges for continuing operations were
€ million, of which € million were in the Industrial Busi-
ness. The tax rate of % was lower than in the prior year, due
mainly to the disposition of the stake in BSH, which was mostly
tax-free. For this reason, Income from continuing operations
increased %.
Income from discontinued operations, net of income taxes,
primarily included gains from the disposal of the hearing aid
and hospital information businesses, totaling € . billion and
€ . billion, respectively.
The increase in Basic earnings per share benefited substan-
tially from the disposal gains mentioned above. The percentage
increase was higher than for Net income due mainly to share buy-
backs which reduced the number of average shares outstanding.
Despite a significant increase in average capital employed with
the acquisitions at Power and Gas, ROCE rose due to the dis-
posal gains and was at the upper end of our target range.