Siemens 2015 Annual Report Download - page 80
Download and view the complete annual report
Please find page 80 of the 2015 Siemens annual report below. You can navigate through the pages in the report by either clicking on the pages listed below, or by using the keyword search tool below to find specific information within the annual report.-
 1
1 -
2
-
3
-
4
-
5
-
6
-
7
-
8
-
9
-
10
-
11
-
12
-
13
-
14
-
15
-
16
-
17
-
18
-
19
-
20
-
21
-
22
-
23
-
24
-
25
-
26
-
27
-
28
-
29
-
30
-
31
-
32
-
33
-
34
-
35
-
36
-
37
-
38
-
39
-
40
-
41
-
42
-
43
-
44
-
45
-
46
-
47
-
48
-
49
-
50
-
51
-
52
-
53
-
54
-
55
-
56
-
57
-
58
-
59
-
60
-
61
-
62
-
63
-
64
-
65
-
66
-
67
-
68
-
69
-
 70
70 -
 71
71 -
 72
72 -
 73
73 -
 74
74 -
 75
75 -
 76
76 -
 77
77 -
 78
78 -
 79
79 -
 80
80 -
 81
81 -
 82
82 -
 83
83 -
 84
84 -
 85
85 -
 86
86 -
 87
87 -
 88
88 -
 89
89 -
 90
90 -
91
-
92
-
93
-
94
-
95
-
96
-
97
-
98
-
99
-
100
-
101
-
102
-
103
-
104
-
105
-
106
-
107
-
108
-
109
-
110
-
111
-
112
-
113
-
114
-
115
-
116
-
117
-
118
-
119
-
120
-
121
-
122
-
123
-
124
-
125
-
126
-
127
-
128
-
129
-
130
-
131
-
132
-
133
-
134
-
135
-
136
-
137
-
138
-
139
-
140
 |
 |
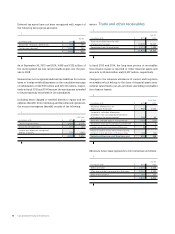
Consolidated Financial Statements
NOTE 12 Other intangible assets and
property, plant and equipment
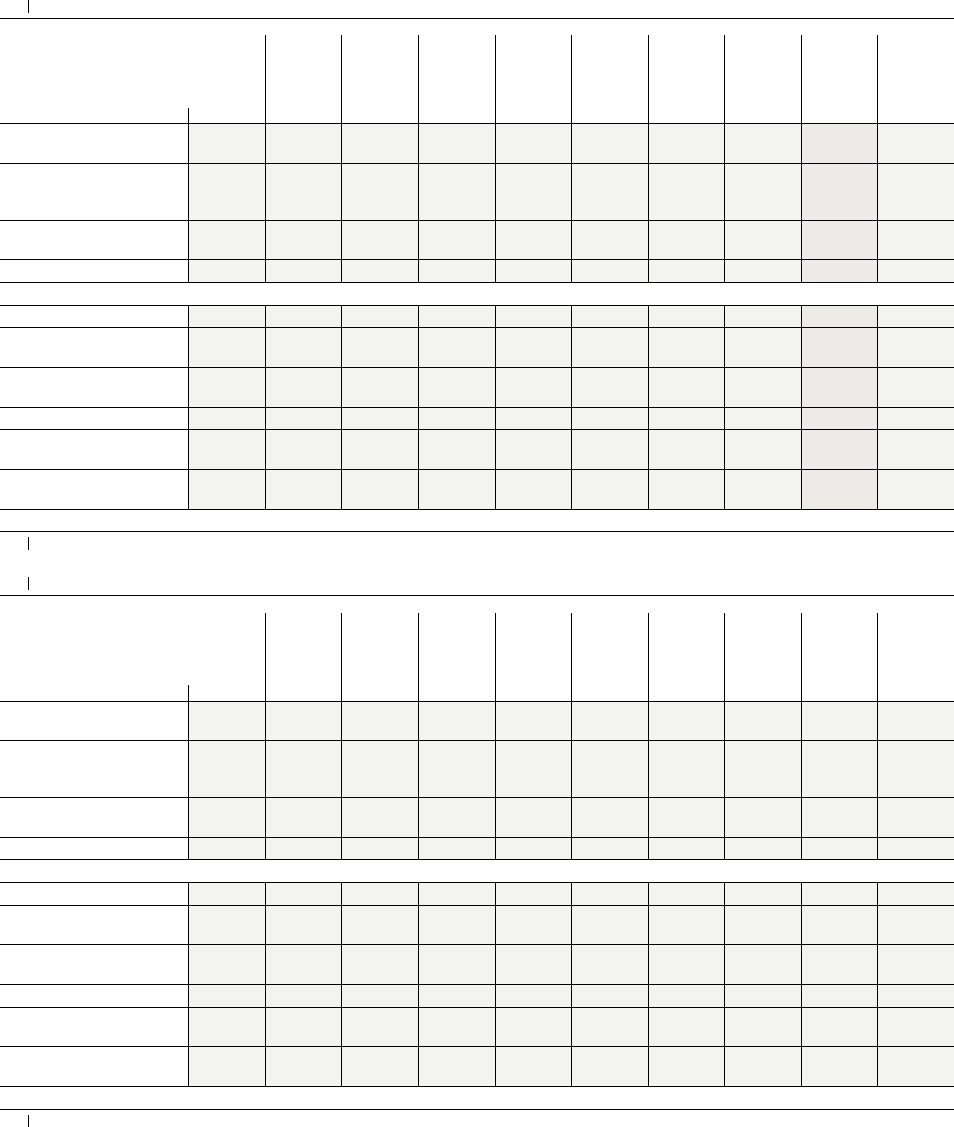
Gross
carrying
amount
10/01/2014
Translation
differences
Additions
through
business
combi-
nations
Additions Reclassi-
fications
Retire -
ments
Gross
carrying
amount
09/30/2015
Accumu-
lated
deprecia-
tion/amorti-
zation and
impairment
Carrying
amount
09/30/2015
Deprecia-
tion/amorti-
zation and
impairment
in fiscal
2015
(in millions of €)
Internally generated
technology 2,750 211 − 337 − (302) 2,995 (1,619) 1,376 (176)
Acquired technology
including patents, licenses
and similar rights 3,525 190 923 53 − 34 4,725 (2,851) 1,874 (231)
Customer relationships
and trademarks 4,552 293 2,873 − − (176) 7,542 (2,715) 4,827 (370)
Other intangible assets 10,826 693 3,796 390 − (444) 15,262 (7,185) 8,077 (778)
Land and bulidings 7,356 169 143 199 135 (257) 7,745 (3,656) 4,089 (256)
Technical machinery and
equipment 7,140 167 172 282 263 (252) 7,770 (5,111) 2,660 (513)
Furniture and office
equipment 5,786 109 49 580 73 (768) 5,829 (4,510) 1,319 (662)
Equipment leased to others 2,927 117 57 457 (4) (521) 3,033 (1,746) 1,287 (345)
Advances to suppliers and
construction in progress 760 5 66 500 (467) (7) 856 (1) 855 6
Property, plant
and equipment 23,968 566 487 2,018 − (1,805) 25,234 (15,024) 10,210 (1,769)
1 Included assets reclassified to Assets classified as held for disposal and dispositions of those entities.
Gross
carrying
amount
10/01/2013
Translation
differences
Additions
through
business
combi-
nations
Additions Reclassi-
fications
Retire -
ments
Gross
carrying
amount
09/30/2014
Accumu-
lated
deprecia-
tion/amorti-
zation and
impairment
Carrying
amount
09/30/2014
Deprecia-
tion/amorti-
zation and
impairment
in fiscal
2014
(in millions of €)
Internally generated
technology 3,346 111 − 312 − (1,019) 2,750 (1,526) 1,224 (174)
Acquired technology
including patents, licenses
and similar rights 3,505 130 16 78 − (204) 3,525 (2,461) 1,064 (246)
Customer relationships
and trademarks 4,565 148 5 − − (166) 4,552 (2,280) 2,273 (309)
Other intangible assets 11,415 388 21 390 − (1,389) 10,826 (6,266) 4,560 (730)
Land and bulidings 7,677 136 (7) 155 128 (733) 7,356 (3,489) 3,868 (238)
Technical machinery and
equipment 7,020 122 4 277 239 (521) 7,140 (4,687) 2,453 (453)
Furniture and office
equipment 5,740 106 2 608 81 (751) 5,786 (4,440) 1,347 (645)
Equipment leased to others 2,936 104 − 371 1 (485) 2,927 (1,705) 1,222 (316)
Advances to suppliers and
construction in progress 710 7 − 516 (449) (25) 760 (10) 750 −
Property, plant
and equipment 24,083 475 − 1,927 − (2,515) 23,968 (14,330) 9,638 (1,652)
1 Included assets reclassified to Assets classified as held for disposal and dispositions of those entities.