Siemens 2015 Annual Report Download - page 17
Download and view the complete annual report
Please find page 17 of the 2015 Siemens annual report below. You can navigate through the pages in the report by either clicking on the pages listed below, or by using the keyword search tool below to find specific information within the annual report.-
 1
1 -
2
-
3
-
4
-
5
-
6
-
 7
7 -
 8
8 -
 9
9 -
 10
10 -
 11
11 -
 12
12 -
 13
13 -
 14
14 -
 15
15 -
 16
16 -
 17
17 -
 18
18 -
 19
19 -
 20
20 -
 21
21 -
 22
22 -
 23
23 -
 24
24 -
 25
25 -
 26
26 -
 27
27 -
28
-
29
-
30
-
31
-
32
-
33
-
34
-
35
-
36
-
37
-
38
-
39
-
40
-
41
-
42
-
43
-
44
-
45
-
46
-
47
-
48
-
49
-
50
-
51
-
52
-
53
-
54
-
55
-
56
-
57
-
58
-
59
-
60
-
61
-
62
-
63
-
64
-
65
-
66
-
67
-
68
-
69
-
70
-
71
-
72
-
73
-
74
-
75
-
76
-
77
-
78
-
79
-
80
-
81
-
82
-
83
-
84
-
85
-
86
-
87
-
88
-
89
-
90
-
91
-
92
-
93
-
94
-
95
-
96
-
97
-
98
-
99
-
100
-
101
-
102
-
103
-
104
-
105
-
106
-
107
-
108
-
109
-
110
-
111
-
112
-
113
-
114
-
115
-
116
-
117
-
118
-
119
-
120
-
121
-
122
-
123
-
124
-
125
-
126
-
127
-
128
-
129
-
130
-
131
-
132
-
133
-
134
-
135
-
136
-
137
-
138
-
139
-
140
 |
 |

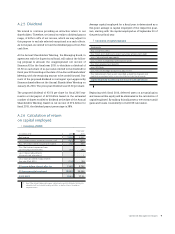
Combined Management Report
Sep 30, % Change
(in millions of €) 2015 2014
Cash and cash equivalents 9,957 8,013 24%
Available-for-sale financial assets 1,175 925 27%
Trade and other receivables 15,982 14,526 10%
Other current financial assets 5,157 3,710 39%
Inventories 17,253 15,100 14%
Current income tax assets 644 577 12%
Other current assets 1,151 1,290 (11)%
Assets classified as held for disposal 122 3,935 (97)%
Total current assets 51,442 48,076 7%
Goodwill 23,166 17,783 30%
Other intangible assets 8,077 4,560 77%
Property, plant and equipment 10,210 9,638 6%
Investments accounted for using the equity method 2,947 2,127 39%
Other financial assets 20,821 18,416 13%
Deferred tax assets 2,591 3,334 (22)%
Other assets 1,094 945 16%
Total non-current assets 68,906 56,803 21%
Total assets 120,348 104,879 15%
Our total assets in fiscal were influenced by positive cur-
rency translation effects of € . billion, led by the U. S. dollar.
In fiscal , the acquisitions of Dresser- Rand and Rolls-Royce
Energy aero-derivative gas turbine and compressor business
were the major factors related to the increases in goodwill and
other intangible assets with a total amount of € . billion and
€ . billion, respectively, and the largest factors related to the
increase in inventories and trade and other receivables with
a total amount of € . billion and € . billion, respectively.
Apart from these acquisitions, the increase in inventories was
also driven by a substantial build-up in other businesses from
the Power and Gas and in the Mobility Divisions, while the
Wind Power and Renewables Division contributed significantly
to the increase in trade and other receivables.
Higher loans receivable driven by asset growth at SFS in fiscal
resulted in the increases in other current financial assets
and in other financial assets.
Mainly the following transactions led to the decrease in assets
classified as held for disposal: Completion of the contribu-
tion of the metals technologies business into a joint venture
with Mitsubishi- Hitachi Metals Machinery Inc. (the new invest-
ment in Primetals Technologies Ltd. is recognized as invest-
ments accounted for using the equity method); completion of
the sale of our % stake in the joint venture BSH to Robert
Bosch GmbH and completion of the sale of the hospital infor-
mation business to Cerner Corp.
A. Net assets position