Siemens 2015 Annual Report Download - page 19
Download and view the complete annual report
Please find page 19 of the 2015 Siemens annual report below. You can navigate through the pages in the report by either clicking on the pages listed below, or by using the keyword search tool below to find specific information within the annual report.-
 1
1 -
2
-
3
-
4
-
5
-
6
-
7
-
8
-
 9
9 -
 10
10 -
 11
11 -
 12
12 -
 13
13 -
 14
14 -
 15
15 -
 16
16 -
 17
17 -
 18
18 -
 19
19 -
 20
20 -
 21
21 -
 22
22 -
 23
23 -
 24
24 -
 25
25 -
 26
26 -
 27
27 -
 28
28 -
 29
29 -
30
-
31
-
32
-
33
-
34
-
35
-
36
-
37
-
38
-
39
-
40
-
41
-
42
-
43
-
44
-
45
-
46
-
47
-
48
-
49
-
50
-
51
-
52
-
53
-
54
-
55
-
56
-
57
-
58
-
59
-
60
-
61
-
62
-
63
-
64
-
65
-
66
-
67
-
68
-
69
-
70
-
71
-
72
-
73
-
74
-
75
-
76
-
77
-
78
-
79
-
80
-
81
-
82
-
83
-
84
-
85
-
86
-
87
-
88
-
89
-
90
-
91
-
92
-
93
-
94
-
95
-
96
-
97
-
98
-
99
-
100
-
101
-
102
-
103
-
104
-
105
-
106
-
107
-
108
-
109
-
110
-
111
-
112
-
113
-
114
-
115
-
116
-
117
-
118
-
119
-
120
-
121
-
122
-
123
-
124
-
125
-
126
-
127
-
128
-
129
-
130
-
131
-
132
-
133
-
134
-
135
-
136
-
137
-
138
-
139
-
140
 |
 |

Combined Management Report
€ . billion). Within these figures, the underfunding for pension
benefit plans amounted to € . billion (September , :
€ . billion) and the underfunding of other post- employment
benefit plans amounted to € . billion (September , :
€ . billion).
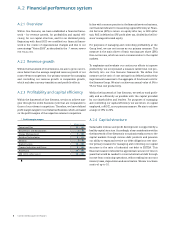
Capital structure ratio
Our capital structure ratio as of September , increased
to . from . a year earlier, which is within our target ratio of
up to .. The change was due to the increase in industrial
net debt compared to the prior year, reflecting the above-
mentioned issuance of long-term debt and the impact of our
share buybacks.
After the end of fiscal we repurchased additional ,,
treasury shares. We thus completed the share buyback program
in October with a total volume of € . billion and an aver-
age costs per share of € . (including incidental transaction
charges).
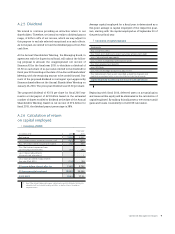
Debt and credit facilities
As of September , we recorded, in total, € . billion in
notes and bonds (maturing until ), € . billion in loans
from banks (maturing until ), € . billion in other financial
indebtedness (maturing until ), primarily consisting of
US$-commercial paper, and € . billion in obligations under
finance leases. Notes, bonds and loans from banks were is-
sued mainly in Euro and U. S. dollar, and to a lower extent in
British pound.
In order to optimize the Company’s position with regard to
interest income and interest expense, and to manage the asso-
ciated interest rate risk relating to the Group excluding SFS’
business, we use derivative financial instruments under a port-
folio-based approach to manage interest risk actively relative to
a benchmark. The interest rate management relating to the SFS
business is managed separately, considering the term structure
of SFS’ financial assets and liabilities on a portfolio basis.
We have three credit facilities at our disposal for general corpo-
rate purposes. These credit facilities amounted to € . billion
and were unused as of September , .
For further information about our debt see NOTE 15 in
B.6 NOTES TO CONSOLIDATED FINANCIAL STATEMENTS. For further
information about functions and objectives of the financial
management see NOTE 24 in B.6 NOTES TO CONSOLIDATED
FINANCIAL STATEMENTS.
Off-balance-sheet commitments
As of September , the undiscounted amount of maxi-
mum potential future payments related to credit guarantees,
guarantees of third-party performance and HERKULES obliga-
tions amounted to € . billion (September , : € . billion).
Other commitments, including indemnifications issued in con-
nection with dispositions of businesses, amounted to € . bil-
lion (September , : € . billion) to the extent future
claims are not considered remote. The increase in other com-
mitments related mainly to transactions closed in fiscal .
Future payment obligations under non-cancellable operating
leases amounted to € . billion (September , : € . bil-
lion).
Irrevocable loan commitments amounted to € . billion (Sep-
tember , : € . billion). A considerable portion of these
commitments resulted from asset-based lending transactions,
meaning that the respective loans can be drawn only after the
borrower has provided sufficient collateral.