Siemens 2015 Annual Report Download - page 21
Download and view the complete annual report
Please find page 21 of the 2015 Siemens annual report below. You can navigate through the pages in the report by either clicking on the pages listed below, or by using the keyword search tool below to find specific information within the annual report.-
 1
1 -
2
-
3
-
4
-
5
-
6
-
7
-
8
-
9
-
10
-
 11
11 -
 12
12 -
 13
13 -
 14
14 -
 15
15 -
 16
16 -
 17
17 -
 18
18 -
 19
19 -
 20
20 -
 21
21 -
 22
22 -
 23
23 -
 24
24 -
 25
25 -
 26
26 -
 27
27 -
 28
28 -
 29
29 -
 30
30 -
 31
31 -
32
-
33
-
34
-
35
-
36
-
37
-
38
-
39
-
40
-
41
-
42
-
43
-
44
-
45
-
46
-
47
-
48
-
49
-
50
-
51
-
52
-
53
-
54
-
55
-
56
-
57
-
58
-
59
-
60
-
61
-
62
-
63
-
64
-
65
-
66
-
67
-
68
-
69
-
70
-
71
-
72
-
73
-
74
-
75
-
76
-
77
-
78
-
79
-
80
-
81
-
82
-
83
-
84
-
85
-
86
-
87
-
88
-
89
-
90
-
91
-
92
-
93
-
94
-
95
-
96
-
97
-
98
-
99
-
100
-
101
-
102
-
103
-
104
-
105
-
106
-
107
-
108
-
109
-
110
-
111
-
112
-
113
-
114
-
115
-
116
-
117
-
118
-
119
-
120
-
121
-
122
-
123
-
124
-
125
-
126
-
127
-
128
-
129
-
130
-
131
-
132
-
133
-
134
-
135
-
136
-
137
-
138
-
139
-
140
 |
 |

Combined Management Report
The change in short-term debt and other financing activi-
ties included the net proceeds from the issuance of commer-
cial paper, partly offset by cash outflows related to the settle-
ment of financial derivatives used to hedge currency exposure
in our financing activities.
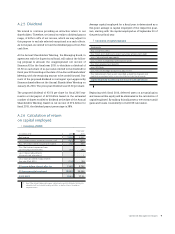
We report Free cash flow as a supplemental liquidity measure:
Free cash flow
Fiscal year 2015
Continuing
operations
Discontinued
operations
Continuing and
discontinued operations
(in millions of €)
Cash flows from operating activities 6,881 (270) 6,612
Additions to intangible assets and property, plant and equipment (1,897) (40) (1,938)
Free cash flow 4,984 (310) 4,674
With our ability to generate positive operating cash flows, our
total liquidity (defined as cash and cash equivalents as well
as available-for-sale financial assets) of € . billion, and our
€ . billion in unused lines of credit, and given our credit ratings
at year-end, we believe that we have sufficient flexibility to fund
our capital requirements. Also in our opinion, our operating net
working capital is sufficient for our present requirements.
Investing activities
Additions to intangible assets and property, plant and equip-
ment from continuing operations was € . billion in fiscal .
Within the Industrial Business ongoing investments related
mainly to technological innovations; extending our capacities
for designing, manufacturing and marketing new solutions; im-
proving productivity and our global footprint, such as in Brazil,
Egypt and India; and replacements of fixed assets. These invest-
ments amounted to € . billion in fiscal . The remaining
portion in fiscal , € . billion, related mainly to SRE, includ-
ing significant amounts related to office projects, such as new
corporate office buildings in Germany. SRE is responsible for
uniform and comprehensive management of Company real es-
tate worldwide, and supports the Industrial Business and cor-
porate activities with customer-specific real estate solutions.
With regard to capital expenditures for continuing operations,
we expect a spending increase year-over-year in fiscal .
Focus areas of ongoing investing activities of the Industrial
Business are:
The investments of Power and Gas are focused on enhancing
productivity and strategic localization, mainly relating to our
large gas turbines and generators business, including a burner
test center for gas turbines in Germany.
The investments of Wind Power and Renewables are focused
on the extension, modernization and optimization of existing
plants to allow for the large-scale manufacturing of innovative
products, including new production and service facilities for
blades in the U. K. and an offshore wind power turbines plant in
Germany.
Energy Management is spending the larger portion of its cap-
ital expenditures for innovation, particularly in the low voltage
and product business. Further investments are related to re-
placement of fixed assets and expansion of factories and tech-
nical equipment.
The investments of Building Technologies mainly relate to the
control products and systems business, particularly innovation
projects.
Mobility is spending large portions of its capital expenditures
for improving its respective positions in growing market seg-
ments, including investments into its infrastructure, capital-
ized R & D expenses as well as project related investments.
Major spending of Digital Factory relates to the factory auto-
mation and control products businesses, including investments
in production facilities in China.
The investments of Process Industries and Drives are focused
on upgrading production machines and replacement of fixed
assets, particularly relating to the large drives business.
Healthcare’s investments are mainly driven by the diagnostics
business, including large amounts relating to intangible assets,
particularly capitalized R & D expenses for new platforms.