Siemens 2015 Annual Report Download - page 102
Download and view the complete annual report
Please find page 102 of the 2015 Siemens annual report below. You can navigate through the pages in the report by either clicking on the pages listed below, or by using the keyword search tool below to find specific information within the annual report.-
 1
1 -
2
-
3
-
4
-
5
-
6
-
7
-
8
-
9
-
10
-
11
-
12
-
13
-
14
-
15
-
16
-
17
-
18
-
19
-
20
-
21
-
22
-
23
-
24
-
25
-
26
-
27
-
28
-
29
-
30
-
31
-
32
-
33
-
34
-
35
-
36
-
37
-
38
-
39
-
40
-
41
-
42
-
43
-
44
-
45
-
46
-
47
-
48
-
49
-
50
-
51
-
52
-
53
-
54
-
55
-
56
-
57
-
58
-
59
-
60
-
61
-
62
-
63
-
64
-
65
-
66
-
67
-
68
-
69
-
70
-
71
-
72
-
73
-
74
-
75
-
76
-
77
-
78
-
79
-
80
-
81
-
82
-
83
-
84
-
85
-
86
-
87
-
88
-
89
-
90
-
91
-
 92
92 -
 93
93 -
 94
94 -
 95
95 -
 96
96 -
 97
97 -
 98
98 -
 99
99 -
 100
100 -
 101
101 -
 102
102 -
 103
103 -
 104
104 -
 105
105 -
 106
106 -
 107
107 -
 108
108 -
 109
109 -
 110
110 -
 111
111 -
 112
112 -
113
-
114
-
115
-
116
-
117
-
118
-
119
-
120
-
121
-
122
-
123
-
124
-
125
-
126
-
127
-
128
-
129
-
130
-
131
-
132
-
133
-
134
-
135
-
136
-
137
-
138
-
139
-
140
 |
 |

Consolidated Financial Statements
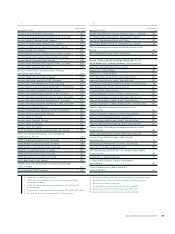
NOTE 27 Earnings per share
Fiscal year
(shares in thousands; earnings per share in €) 2015 2014
Income from continuing operations 5,349 5,292
Less: Portion attributable to
non-controlling interest (98) (134)
Income from continuing operations
attributable to shareholders of Siemens AG 5,251 5,159
Weighted average shares outstanding – basic 823,408 843,449
Effect of dilutive share-based payment 9,425 8,485
Weighted average shares outstanding – diluted 832,832 851,934
Basic earnings per share
(from continuing operations) 6.38 6.12
Diluted earnings per share
(from continuing operations) 6.30 6.06
The dilutive earnings per share computation in fiscal and
does not contain , million and , million shares,
respectively, relating to warrants issued with bonds. The inclu-
sion of those shares would have been antidilutive in the years
presented. In the future, the warrants could potentially dilute
basic earnings per share.
NOTE 28 Segment information
Orders
External revenue Intersegment Revenue Total revenue
Fiscal year Fiscal year Fiscal year Fiscal year
(in millions of €) 2015 2014 2015 2014 2015 2014 2015 2014
Power and Gas 15,666 13,996 13,105 12,668 88 52 13,193 12,720
Wind Power and Renewables 6,136 7,759 5,658 5,566 215,660 5,567
Energy Management 12,956 11,210 11,344 10,139 578 568 11,922 10,708
Building Technologies 6,099 5,587 5,860 5,446 139 123 5,999 5,569
Mobility 10,262 9,280 7,477 7,232 31 17 7,508 7,249
Digital Factory 10,014 9,233 9,030 8,430 926 771 9,956 9,201
Process Industries and Drives 9,337 9,968 8,113 7,896 1,780 1,749 9,894 9,645
Healthcare 13,349 12,126 12,896 11,707 35 29 12,930 11,736
Industrial Business 83,819 79,158 73,483 69,085 3,579 3,311 77,062 72,396
Financial Services (SFS) 1,048 937 855 746 193 191 1,048 937
Reconciliation to
Consolidated Financial Statements (2,527) (2,438) 1,298 1,396 (3,772) (3,502) (2,475) (2,106)
Siemens (continuing operations) 82,340 77,657 75,636 71,227 −−75,636 71,227
1 This supplemental information on Orders is provided on a voluntary basis.
It is not part of the Consolidated Financial Statements subject to the audit opinion.