Siemens 2015 Annual Report Download - page 18
Download and view the complete annual report
Please find page 18 of the 2015 Siemens annual report below. You can navigate through the pages in the report by either clicking on the pages listed below, or by using the keyword search tool below to find specific information within the annual report.-
 1
1 -
2
-
3
-
4
-
5
-
6
-
7
-
 8
8 -
 9
9 -
 10
10 -
 11
11 -
 12
12 -
 13
13 -
 14
14 -
 15
15 -
 16
16 -
 17
17 -
 18
18 -
 19
19 -
 20
20 -
 21
21 -
 22
22 -
 23
23 -
 24
24 -
 25
25 -
 26
26 -
 27
27 -
 28
28 -
29
-
30
-
31
-
32
-
33
-
34
-
35
-
36
-
37
-
38
-
39
-
40
-
41
-
42
-
43
-
44
-
45
-
46
-
47
-
48
-
49
-
50
-
51
-
52
-
53
-
54
-
55
-
56
-
57
-
58
-
59
-
60
-
61
-
62
-
63
-
64
-
65
-
66
-
67
-
68
-
69
-
70
-
71
-
72
-
73
-
74
-
75
-
76
-
77
-
78
-
79
-
80
-
81
-
82
-
83
-
84
-
85
-
86
-
87
-
88
-
89
-
90
-
91
-
92
-
93
-
94
-
95
-
96
-
97
-
98
-
99
-
100
-
101
-
102
-
103
-
104
-
105
-
106
-
107
-
108
-
109
-
110
-
111
-
112
-
113
-
114
-
115
-
116
-
117
-
118
-
119
-
120
-
121
-
122
-
123
-
124
-
125
-
126
-
127
-
128
-
129
-
130
-
131
-
132
-
133
-
134
-
135
-
136
-
137
-
138
-
139
-
140
 |
 |

Combined Management Report
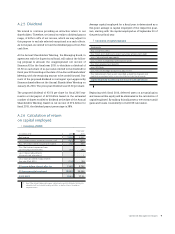
A.5.1 Capital structure
Our capital structure developed as follows:
Sep 30, % Change
(in millions of €) 2015 2014
Short-term debt and current maturities of long-term debt 2,979 1,620 84%
Trade payables 7,774 7,594 2%
Other current financial liabilities 2,085 1,717 21%
Current provisions 4,489 4,354 3%
Current income tax liabilities 1,828 1,762 4%
Other current liabilities 20,368 17,954 13%
Liabilities associated with assets classified as held for disposal 39 1,597 (98)%
Total current liabilities 39,562 36,598 8%
Long-term debt 26,682 19,326 38%
Post-employment benefits 9,811 9,324 5%
Deferred tax liabilities 609 552 10%
Provisions 4,865 4,071 20%
Other financial liabilities 1,466 1,620 (9)%
Other liabilities 2,297 1,874 23%
Total non-current liabilities 45,730 36,767 24%
Total liabilities 85,292 73,365 16%
Debt ratio 71% 70%
Total equity attributable to shareholders of Siemens AG 34,474 30,954 11%
Equity ratio 29% 30%
Non-controlling interests 581 560 4%
Total liabilities and equity 120,348 104,879 15%
The classification of US$ million long-term fixed-rate in-
struments as current maturity and the issuance of commercial
paper were the main factors for the increase in short-term
debt and current maturities of long-term debt.
The project business of the Divisions Power and Gas, including
additions related to the acquisitions of Dresser- Rand and Rolls-
Royce Energy aero-derivative gas turbine and compressor busi-
ness, and Wind Power and Renewables was the main factor for
an increase in higher billings in excess of costs and estimated
earnings on uncompleted contracts and related advances,
which drove mainly the increase in other current liabilities.
The contribution of the metals technologies business into a
joint venture with Mitsubishi-Hitachi Metals Machinery Inc.
led mainly to the decrease in liabilities associated with assets
classified as held for disposal.
A. Financial position
The issuance of instruments totaling US$ . billion in six
tranches with different maturities up to years was the main
factor for the increase in long-term debt.
The main factors relating to the increase in total equity attrib-
utable to shareholders of Siemens AG were € . billion in net
income attributable to shareholders of Siemens AG and € . bil-
lion in other comprehensive income, net of income taxes. This
increase was partly offset by dividend payments of € . billion
(paid for fiscal ) and the repurchase of ,, treasury
shares at an average costs per share of € ., totaling € . bil-
lion (including incidental transaction charges).
Post-employment benefits
The funded status of our defined benefit plans – meaning de-
fined benefit obligation (DBO) less fair value of plan assets –
showed an underfunding of € . billion (September , :