Siemens 2015 Annual Report Download - page 93
Download and view the complete annual report
Please find page 93 of the 2015 Siemens annual report below. You can navigate through the pages in the report by either clicking on the pages listed below, or by using the keyword search tool below to find specific information within the annual report.-
 1
1 -
2
-
3
-
4
-
5
-
6
-
7
-
8
-
9
-
10
-
11
-
12
-
13
-
14
-
15
-
16
-
17
-
18
-
19
-
20
-
21
-
22
-
23
-
24
-
25
-
26
-
27
-
28
-
29
-
30
-
31
-
32
-
33
-
34
-
35
-
36
-
37
-
38
-
39
-
40
-
41
-
42
-
43
-
44
-
45
-
46
-
47
-
48
-
49
-
50
-
51
-
52
-
53
-
54
-
55
-
56
-
57
-
58
-
59
-
60
-
61
-
62
-
63
-
64
-
65
-
66
-
67
-
68
-
69
-
70
-
71
-
72
-
73
-
74
-
75
-
76
-
77
-
78
-
79
-
80
-
81
-
82
-
 83
83 -
 84
84 -
 85
85 -
 86
86 -
 87
87 -
 88
88 -
 89
89 -
 90
90 -
 91
91 -
 92
92 -
 93
93 -
 94
94 -
 95
95 -
 96
96 -
 97
97 -
 98
98 -
 99
99 -
 100
100 -
 101
101 -
 102
102 -
 103
103 -
104
-
105
-
106
-
107
-
108
-
109
-
110
-
111
-
112
-
113
-
114
-
115
-
116
-
117
-
118
-
119
-
120
-
121
-
122
-
123
-
124
-
125
-
126
-
127
-
128
-
129
-
130
-
131
-
132
-
133
-
134
-
135
-
136
-
137
-
138
-
139
-
140
 |
 |

Consolidated Financial Statements
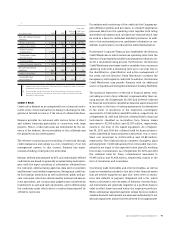
The following table presents the fair values and carrying
amounts of financial assets and financial liabilities measured at
cost or amortized cost for which the carrying amounts do not
approximate fair value:
Sep 30, 2015 Sep 30, 2014
Fair value Carrying
amount
Fair value Carrying
amount
(in millions of €)
Notes and bonds 26,516 25,955 18,787 18,165
Loans from banks and other financial indebtedness 3,544 3,559 2,605 2,626
Obligations under finance leases 207 147 216 156
Fixed-rate and variable-rate receivables with a remaining
term of more than twelve months, including receivables from
finance leases, are evaluated by the Company based on pa-
rameters such as interest rates, specific country risk factors,
individual creditworthiness of the customer, and the risk
characteristics of the financed project. Based on this evalua-
tion, allowances for these receivables are recognized.
The following table allocates financial assets and financial lia-
bilities measured at fair value to the three levels of the fair
value hierarchy:
Sep 30, 2015
(in millions of €) Level 1 Level 2 Level 3 Total
Financial assets measured at fair value 1,980 4,313 374 6,668
Available-for-sale financial assets: Equity instruments 1,980 – 318 2,299
Available-for-sale financial assets: Debt instruments − 1,131 10 1,141
Derivative financial instruments − 3,181 46 3,228
Not designated in a hedge accounting relationship
(including embedded derivatives) − 2,574 46 2,620
In connection with fair value hedges − 329 − 329
In connection with cash flow hedges − 279 − 279
Financial liabilities measured at fair value – Derivative financial instruments − 1,919 − 1,919
Not designated in a hedge accounting relationship
(including embedded derivatives) − 1,383 − 1,383
In connection with cash flow hedges − 534 − 534
The fair value of notes and bonds is based on prices provided
by price service agencies at the period-end date (Level ). The
fair value of loans from banks and other financial indebted-
ness, obligations under finance leases as well as other non-cur-
rent financial liabilities is estimated by discounting future cash
flows using rates currently available for debt of similar terms
and remaining maturities (Level ).