Sony 2013 Annual Report Download - page 28
Download and view the complete annual report
Please find page 28 of the 2013 Sony annual report below. You can navigate through the pages in the report by either clicking on the pages listed below, or by using the keyword search tool below to find specific information within the annual report.-
 1
1 -
2
-
3
-
4
-
5
-
6
-
7
-
8
-
9
-
10
-
11
-
12
-
13
-
14
-
15
-
16
-
17
-
 18
18 -
 19
19 -
 20
20 -
 21
21 -
 22
22 -
 23
23 -
 24
24 -
 25
25 -
 26
26 -
 27
27 -
 28
28 -
 29
29 -
 30
30 -
 31
31 -
 32
32 -
 33
33 -
 34
34 -
 35
35 -
 36
36 -
 37
37 -
 38
38 -
39
-
40
-
41
-
42
-
43
-
44
-
45
-
46
-
47
-
48
-
49
-
50
-
51
-
52
-
53
-
54
-
55
-
56
-
57
-
58
-
59
-
60
-
61
-
62
-
63
-
64
-
65
-
66
 |
 |

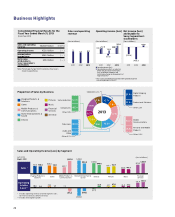
Business Highlights
■Operating income (loss)
■Operating income (loss), as adjusted,
which excludes equity in net income
(loss) of affiliated companies and
restructuring charges and impairments of
long-lived assets*
Consolidated Financial Results for the
Fiscal Year Ended March 31, 2013
(Fiscal Year 2012)
Sales and operating
revenue
Operating income
Income before
income taxes
Net income
attributable to
Sony Corporation’s
stockholders
Note: Percentage change from the previous fiscal year is
shown in parentheses.
¥6,800.9 billion (4.7%)
¥230.1 billion ( — )
¥245.7 billion ( — )
¥43.0 billion ( — )
Sales and operating
revenue
(Yen in trillions)
Operating income (loss)
(Yen in billions)
Net income (loss)
attributable to
Sony Corporation’s
stockholders
(Yen in billions)
* This is not a presentation in accordance with generally accepted
accounting principles in the U.S.
7.2 6.5 6.8
2011 2012 2013 2011 2012 2013
199.8252.8 230.1
323.1
(67.3)
138.5
2011 2012 2013
(456.7)
43.0
(259.6)
Proportion of Sales by Business
Imaging Products &
Solutions
Game
Mobile Products &
Communications
Home Entertainment &
Sound
Devices
Pictures
Music
Financial
Services
All Other
0.7%
Other 1.8%
Corporate
2013
10.7%
7.8%
17.9%
14.6%
8.6%
10.8%
6.3%
14.8%
7.8%
Digital Imaging
Products
Professional Solutions
Mobile
Communications
Personal and Mobile
Products
Televisions
Audio and
Video
Semiconductors
Components
Other 0.7%
Other 2.3%
Other 0.5%
51.7%
46.5%
40.8%
58.5%
35.8%
61.9%
39.4%
60.1%
657.7
442.8
871.9
34.1 36.9
131.4
761.3 730.4 805.0 707.1 622.7
1,257.6
994.8
29.3 7.2
18.6
(203.2)
(84.3)
(97.2)
1.4
1,026.6
848.6
(22.1)
43.9
732.7
441.7
1,007.7
47.8 37.2
1.7
145.8
1,283.2
* Includes operating revenue and intersegment sales;
for Financial Services, denotes revenue.
** Includes intersegment profits.
*
Financial
Services
MusicPicturesDevicesGame Home Entertainment &
Sound
Mobile Products &
Communications
Imaging Products &
Solutions
(Yen in billions)
Sales and Operating Income (Loss) by Segment
Left: 2012
Right: 2013
Sales
Operating
Income
(Loss)**
26