Sprint - Nextel 2006 Annual Report Download - page 136
Download and view the complete annual report
Please find page 136 of the 2006 Sprint - Nextel annual report below. You can navigate through the pages in the report by either clicking on the pages listed below, or by using the keyword search tool below to find specific information within the annual report.-
 1
1 -
2
-
3
-
4
-
5
-
6
-
7
-
8
-
9
-
10
-
11
-
12
-
13
-
14
-
15
-
16
-
17
-
18
-
19
-
20
-
21
-
22
-
23
-
24
-
25
-
26
-
27
-
28
-
29
-
30
-
31
-
32
-
33
-
34
-
35
-
36
-
37
-
38
-
39
-
40
-
41
-
42
-
43
-
44
-
45
-
46
-
47
-
48
-
49
-
50
-
51
-
52
-
53
-
54
-
55
-
56
-
57
-
58
-
59
-
60
-
61
-
62
-
63
-
64
-
65
-
66
-
67
-
68
-
69
-
70
-
71
-
72
-
73
-
74
-
75
-
76
-
77
-
78
-
79
-
80
-
81
-
82
-
83
-
84
-
85
-
86
-
87
-
88
-
89
-
90
-
91
-
92
-
93
-
94
-
95
-
96
-
97
-
98
-
99
-
100
-
101
-
102
-
103
-
104
-
105
-
106
-
107
-
108
-
109
-
110
-
111
-
112
-
113
-
114
-
115
-
116
-
117
-
118
-
119
-
120
-
121
-
122
-
123
-
124
-
125
-
 126
126 -
 127
127 -
 128
128 -
 129
129 -
 130
130 -
 131
131 -
 132
132 -
 133
133 -
 134
134 -
 135
135 -
 136
136 -
 137
137 -
 138
138 -
 139
139 -
 140
140
 |
 |

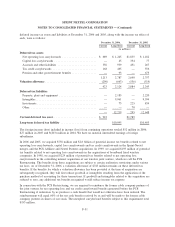
1st 2nd 3rd
(1)
4th
Quarter
(in millions, except per share data)
2006
Net operating revenues ................................ $10,074 $10,014 $10,496 $10,444
Operating income . . . ................................. 484 712 719 569
Income from continuing operations ....................... 164 291 279 261
Net income ......................................... 419 370 279 261
Basic earnings per common share from continuing operations
(2)
. . 0.05 0.10 0.09 0.09
Diluted earnings per common share from continuing
operations
(2)
...................................... 0.05 0.10 0.09 0.09
1st 2nd 3rd 4th
Quarter
(in millions, except per share data)
2005
Net operating revenues .................................... $5,495 $5,677 $7,825 $9,792
Operating income ........................................ 610 746 488 297
Income from continuing operations ........................... 219 334 263 5
Net income ............................................ 472 600 516 197
Basic earnings per common share from continuing operations
(2)
..... 0.15 0.22 0.12 —
Diluted earnings per common share from continuing operations
(2)
.... 0.15 0.22 0.12 —
(1) The third quarter 2006 results presented in the table above include an adjustment of $52 million
($32 million net of tax) relating to the reversal of excess amortization of the Nextel customer relationship
intangible asset previously recognized in our Form 10-Q for the period ended September 30, 2006.
(2) The sum of the quarterly earnings per share amounts may not equal the annual amounts because of the
changes in the weighted average number of shares outstanding during the year.
Note 16. Shareholders’ Equity
Our articles of incorporation authorize 6,620,000,000 shares of capital stock as follows:
• 6,000,000,000 shares of Series 1 voting common stock, par value $2.00 per share;
• 500,000,000 shares of Series 2 voting common stock, par value $2.00 per share;
• 100,000,000 shares of non-voting common stock, par value $0.01 per share; and
• 20,000,000 shares of preferred stock, no par value per share
Classes of Common Stock
Series 1 Common Stock
The holders of our Series 1 common stock are entitled to one vote per share on all matters submitted for
action by the shareholders.
Series 2 Common Stock
The holders of our Series 2 common stock are entitled to 10% of one vote per share, but otherwise have rights
that are substantially identical to those of the Series 1 common stock. There were about 80 million shares of
Series 2 common stock outstanding as of December 31, 2006.
F-59
SPRINT NEXTEL CORPORATION
NOTES TO CONSOLIDATED FINANCIAL STATEMENTS — (Continued)