Sprint - Nextel 2006 Annual Report Download - page 34
Download and view the complete annual report
Please find page 34 of the 2006 Sprint - Nextel annual report below. You can navigate through the pages in the report by either clicking on the pages listed below, or by using the keyword search tool below to find specific information within the annual report.-
 1
1 -
2
-
3
-
4
-
5
-
6
-
7
-
8
-
9
-
10
-
11
-
12
-
13
-
14
-
15
-
16
-
17
-
18
-
19
-
20
-
21
-
22
-
23
-
 24
24 -
 25
25 -
 26
26 -
 27
27 -
 28
28 -
 29
29 -
 30
30 -
 31
31 -
 32
32 -
 33
33 -
 34
34 -
 35
35 -
 36
36 -
 37
37 -
 38
38 -
 39
39 -
 40
40 -
 41
41 -
 42
42 -
 43
43 -
 44
44 -
45
-
46
-
47
-
48
-
49
-
50
-
51
-
52
-
53
-
54
-
55
-
56
-
57
-
58
-
59
-
60
-
61
-
62
-
63
-
64
-
65
-
66
-
67
-
68
-
69
-
70
-
71
-
72
-
73
-
74
-
75
-
76
-
77
-
78
-
79
-
80
-
81
-
82
-
83
-
84
-
85
-
86
-
87
-
88
-
89
-
90
-
91
-
92
-
93
-
94
-
95
-
96
-
97
-
98
-
99
-
100
-
101
-
102
-
103
-
104
-
105
-
106
-
107
-
108
-
109
-
110
-
111
-
112
-
113
-
114
-
115
-
116
-
117
-
118
-
119
-
120
-
121
-
122
-
123
-
124
-
125
-
126
-
127
-
128
-
129
-
130
-
131
-
132
-
133
-
134
-
135
-
136
-
137
-
138
-
139
-
140
 |
 |

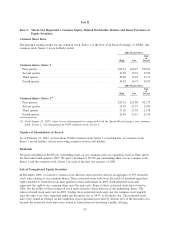
Item 6. Selected Financial Data
The 2006 and 2005 data presented below is not comparable to that of the prior periods as a result of the
Sprint-Nextel merger and the Nextel Partners and the PCS Affiliate acquisitions during 2006 and 2005. The
acquired companies’ financial results subsequent to their acquisition dates are included in our consolidated
financial statements. The spin-off of Embarq in 2006 and our directory publishing business in 2003 are shown
as discontinued operations for all periods presented.
2006 2005 2004 2003 2002
Year Ended December 31,
(in millions, except per share amounts)
Results of Operations
Net operating revenues ..................... $41,028 $ 28,789 $21,647 $20,414 $20,889
Depreciation ............................ 5,738 3,864 3,651 3,909 3,744
Amortization ............................ 3,854 1,336 7 1 4
Operating income (loss)
(1)
.................. 2,484 2,141 (1,999) (729) 417
Income (loss) from continuing operations
(1)
..... 995 821 (2,006) (1,306) (522)
Discontinued operations, net ................. 334 980 994 2,338 1,132
Cumulative effect of change in accounting
principle, net
(4)
......................... — (16) — 258 —
Earnings (loss) per share and dividends
Basic earnings (loss) per common share
(3)
Continuing operations
(1)(2)
................ 0.34 0.40 (1.40) (0.92) (0.38)
Discontinued operations .................. 0.11 0.48 0.69 1.65 0.81
Cumulative effect of change in accounting
principle ............................ — (0.01) — 0.18 —
Diluted earnings (loss) per common share
(3)
Continuing operations
(1)(2)
................ 0.34 0.40 (1.40) (0.92) (0.38)
Discontinued operations .................. 0.11 0.48 0.69 1.65 0.81
Cumulative effect of change in accounting
principle
(4)
.......................... — (0.01) — 0.18 —
Dividends per common share
(5)
............... 0.10 0.30 -----------See (5) below---------
Financial Position
Total assets . ............................ $97,161 $102,760 $41,321 $42,675 $45,113
Property, plant and equipment, net ............ 25,868 23,329 14,662 19,130 21,127
Intangible assets .......................... 60,057 49,307 7,809 7,788 9,019
Total debt and capital lease obligations (including
equity unit notes) ....................... 22,154 25,014 16,425 18,243 20,853
Seventh series redeemable preferred shares ...... — 247 247 247 256
Shareholders’ equity ....................... 53,131 51,937 13,521 13,113 12,108
Cash flow data
Net cash provided by continuing operations ..... $10,055 $ 8,655 $ 4,478 $ 4,141 $ 3,869
Capital expenditures ....................... 7,556 5,057 3,980 3,797 4,821
The tables above set forth selected consolidated financial data for the periods or as of the dates indicated and
should be read in conjunction with the consolidated financial statements, related notes and other financial
information appearing at the end of this annual report on Form 10-K. Highlighted below are certain
transactions and factors that may be significant to an understanding of the comparability of our results of
operations and our financial condition.
(1) In 2006, we recorded net charges of $620 million ($381 million after tax) primarily related to merger and
integration costs, asset impairments, severance and exit costs.
32