Sprint - Nextel 2006 Annual Report Download - page 53
Download and view the complete annual report
Please find page 53 of the 2006 Sprint - Nextel annual report below. You can navigate through the pages in the report by either clicking on the pages listed below, or by using the keyword search tool below to find specific information within the annual report.-
 1
1 -
2
-
3
-
4
-
5
-
6
-
7
-
8
-
9
-
10
-
11
-
12
-
13
-
14
-
15
-
16
-
17
-
18
-
19
-
20
-
21
-
22
-
23
-
24
-
25
-
26
-
27
-
28
-
29
-
30
-
31
-
32
-
33
-
34
-
35
-
36
-
37
-
38
-
39
-
40
-
41
-
42
-
 43
43 -
 44
44 -
 45
45 -
 46
46 -
 47
47 -
 48
48 -
 49
49 -
 50
50 -
 51
51 -
 52
52 -
 53
53 -
 54
54 -
 55
55 -
 56
56 -
 57
57 -
 58
58 -
 59
59 -
 60
60 -
 61
61 -
 62
62 -
 63
63 -
64
-
65
-
66
-
67
-
68
-
69
-
70
-
71
-
72
-
73
-
74
-
75
-
76
-
77
-
78
-
79
-
80
-
81
-
82
-
83
-
84
-
85
-
86
-
87
-
88
-
89
-
90
-
91
-
92
-
93
-
94
-
95
-
96
-
97
-
98
-
99
-
100
-
101
-
102
-
103
-
104
-
105
-
106
-
107
-
108
-
109
-
110
-
111
-
112
-
113
-
114
-
115
-
116
-
117
-
118
-
119
-
120
-
121
-
122
-
123
-
124
-
125
-
126
-
127
-
128
-
129
-
130
-
131
-
132
-
133
-
134
-
135
-
136
-
137
-
138
-
139
-
140
 |
 |

Long Distance
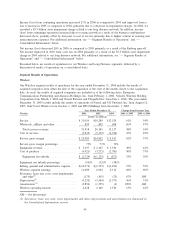
Long Distance 2006 2005 2004 2006 vs 2005 2005 vs 2004
Year Ended December 31, Change from Previous Year
(dollars in millions)
Voice ................................. $3,979 $ 4,213 $ 4,560 (6)% (8)%
Data .................................. 1,440 1,632 1,722 (12)% (5)%
Internet................................ 933 736 793 27% (7)%
Other ................................. 219 253 252 (13)% —%
Total net services revenue ................ 6,571 6,834 7,327 (4)% (7)%
Cost of services and products ............... (4,426) (4,378) (4,249) 1% 3%
Service gross margin ...................... $2,145 $ 2,456 $ 3,078 (13)% (20)%
Service gross margin percentage ............. 33% 36% 42%
Selling, general and administrative expense ..... $(1,169) $(1,434) $(1,962) (18)% (27)%
Long Distance segment earnings ............. 976 1,022 1,116 (5)% (8)%
Severance, lease exit costs, asset impairments and
other
(1)
.............................. (31) (30) (3,653) 3% (99)%
Depreciation
(1)
.......................... (506) (499) (1,081) 1% (54)%
Long Distance operating income (loss) . . . ..... 439 493 (3,618) (11)% 114%
(1) Severance, lease exit costs, asset impairments and other and depreciation are discussed in the Consoli-
dated Information section.
Total Net Services Revenues
Total net services revenues decreased 4% in 2006 as compared to 2005 and decreased 7% in 2005 as
compared to 2004 as a result of a lower priced product mix, the exiting of our unbundled network element
platform, or UNE-P, business in the first quarter 2006 and our conferencing business in the third quarter 2005,
and migration from legacy data products, partially offset by a higher volume of minutes in our wholesale and
affiliate business and increases in our IP revenues. Additionally, the termination of a large Dial IP contract
during 2004 and the sale of our wholesale Dial IP business in 2004 further contributed to the decreased
revenues from 2004 to 2005. These decreases were partially offset by reduced billing adjustments achieved
through improved billing processes and dispute resolution.
In 2007, we expect to see continued revenue growth in IP services, offset by declines in voice revenues due to
lower pricing on commercial contracts and continued pressures in the long distance market. Increased
competition and the excess capacity resulting from new technologies and networks may drive already low
prices down further. See “— Forward-Looking Statements.”
Voice Revenues
Voice revenues decreased 6% in 2006 as compared to 2005 and decreased 8% in 2005 as compared to 2004,
primarily as a result of competition from major local exchange carriers and cable MSOs for our consumer and
small business customers, as well as wireless, e-mail and instant messaging substitution. Additionally, the
2006 decrease reflects the sale of our UNE-P customers in the first quarter 2006.
Our retail business experienced a 23% decrease in voice revenues from 2005 to 2006 as competition resulted
in lower prices per minute notwithstanding increased minute volumes. Market trends indicate a shift away
from the retail business and towards the wholesale business.
Voice revenues related to our wholesale business increased about 25% from 2005 to 2006. Minute volume
increases drove about 86% of this increase, primarily as a result of our relationship with Embarq and several
large cable MSOs, to which we provide local and long distance communications services that they offer to
their customers as part of their bundled service offerings.
51