Sprint - Nextel 2006 Annual Report Download - page 54
Download and view the complete annual report
Please find page 54 of the 2006 Sprint - Nextel annual report below. You can navigate through the pages in the report by either clicking on the pages listed below, or by using the keyword search tool below to find specific information within the annual report.-
 1
1 -
2
-
3
-
4
-
5
-
6
-
7
-
8
-
9
-
10
-
11
-
12
-
13
-
14
-
15
-
16
-
17
-
18
-
19
-
20
-
21
-
22
-
23
-
24
-
25
-
26
-
27
-
28
-
29
-
30
-
31
-
32
-
33
-
34
-
35
-
36
-
37
-
38
-
39
-
40
-
41
-
42
-
43
-
 44
44 -
 45
45 -
 46
46 -
 47
47 -
 48
48 -
 49
49 -
 50
50 -
 51
51 -
 52
52 -
 53
53 -
 54
54 -
 55
55 -
 56
56 -
 57
57 -
 58
58 -
 59
59 -
 60
60 -
 61
61 -
 62
62 -
 63
63 -
 64
64 -
65
-
66
-
67
-
68
-
69
-
70
-
71
-
72
-
73
-
74
-
75
-
76
-
77
-
78
-
79
-
80
-
81
-
82
-
83
-
84
-
85
-
86
-
87
-
88
-
89
-
90
-
91
-
92
-
93
-
94
-
95
-
96
-
97
-
98
-
99
-
100
-
101
-
102
-
103
-
104
-
105
-
106
-
107
-
108
-
109
-
110
-
111
-
112
-
113
-
114
-
115
-
116
-
117
-
118
-
119
-
120
-
121
-
122
-
123
-
124
-
125
-
126
-
127
-
128
-
129
-
130
-
131
-
132
-
133
-
134
-
135
-
136
-
137
-
138
-
139
-
140
 |
 |
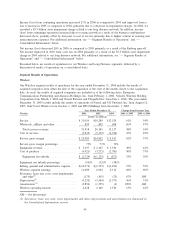
Voice revenues generated from the provision of services to Wireless subscribers represented 17% of total voice
revenues in 2006 compared to 14% in 2005.
Data Revenues
Data revenues reflect sales of legacy data services, including ATM, frame relay and managed network services.
Data revenues decreased 12% in 2006 as compared to 2005 and decreased 5% in 2005 as compared to 2004,
primarily related to declines in frame relay and ATM services as customers migrated to IP-based technologies.
These declines were partially offset by growth in managed network services.
Internet Revenues
Internet revenues reflect sales of IP-based data services, including MPLS. Internet revenues increased 27% in
2006 as compared to 2005 and decreased 7% in 2005 as compared to 2004. The 2006 increase was due to
higher dedicated IP revenues as business customers increasingly migrate to MPLS services. The 2005 decline
was primarily due to the loss of the Dial IP revenues due to the sale of our Dial IP business in October 2004.
Other Revenues
Other revenues decreased 13% in 2006 as compared to 2005 and 2004 as a result of fewer customer premises
equipment, or CPE, projects in 2006 compared to prior years.
Costs of Services and Products
Costs of services and products include access costs paid to local phone companies, other domestic service
providers and foreign phone companies to complete calls made by our domestic customers, costs to operate
and maintain our networks and costs of equipment. Costs of services and products increased 1% in 2006 and
3% in 2005. The increases relate primarily to network costs to support growth in our cable initiatives in
addition to increased domestic access volume, partially offset by fewer CPE projects in 2006, the loss of
UNE-P customers in the first quarter 2006 and renegotiated access rate agreements and initiatives to reduce
access circuit costs. The 2005 increase was driven by access volume and international access costs, somewhat
offset by renegotiated access rate agreements and initiatives to reduce access circuit costs.
Service gross margin decreased from 42% in 2004 to 36% in 2005 to 33% in 2006 primarily as a result of
declining net services revenues and a lower margin product mix.
Selling, General and Administrative Expense
Selling, general and administrative expense decreased 18% in 2006 as compared to 2005 and decreased 27%
in 2005 as compared to 2004. The 2006 decline was due primarily to decreased marketing and advertising as a
result of a change in the mix of marketing strategies and other cost savings that resulted in lower general and
administrative and information technology expenses. The 2005 decline was due primarily to continued
restructuring efforts, headcount reductions, aggressive cost savings initiatives, reduced rent costs and lower bad
debt expense.
Selling, general and administrative expense includes charges for estimated bad debt expense. Every quarter we
reassess our allowance for doubtful accounts, based on customer-specific indicators, as well as historical trends
and industry data, to ensure we are adequately reserved. Bad debt expense for 2006 decreased to $11 million
from $30 million in 2005, which was a decrease from $142 million in 2004. The improvement in bad debt
expense reflects improved trends in collections and agings. The allowance for doubtful accounts as a
percentage of outstanding accounts receivable was 4% in 2006 and 8% in 2005.
Total selling, general and administrative expense as a percentage of net services revenues was 18% in 2006,
21% in 2005, and 27% in 2004.
Long Distance Segment Earnings
Long Distance segment earnings decreased 5% in 2006 from 2005 as compared to a decrease of 8% in 2005
from 2004, primarily due to voice revenue declines related to customer migrations to alternate sources such as
cable and wireless.
52