Sprint - Nextel 2006 Annual Report Download - page 49
Download and view the complete annual report
Please find page 49 of the 2006 Sprint - Nextel annual report below. You can navigate through the pages in the report by either clicking on the pages listed below, or by using the keyword search tool below to find specific information within the annual report.-
 1
1 -
2
-
3
-
4
-
5
-
6
-
7
-
8
-
9
-
10
-
11
-
12
-
13
-
14
-
15
-
16
-
17
-
18
-
19
-
20
-
21
-
22
-
23
-
24
-
25
-
26
-
27
-
28
-
29
-
30
-
31
-
32
-
33
-
34
-
35
-
36
-
37
-
38
-
 39
39 -
 40
40 -
 41
41 -
 42
42 -
 43
43 -
 44
44 -
 45
45 -
 46
46 -
 47
47 -
 48
48 -
 49
49 -
 50
50 -
 51
51 -
 52
52 -
 53
53 -
 54
54 -
 55
55 -
 56
56 -
 57
57 -
 58
58 -
 59
59 -
60
-
61
-
62
-
63
-
64
-
65
-
66
-
67
-
68
-
69
-
70
-
71
-
72
-
73
-
74
-
75
-
76
-
77
-
78
-
79
-
80
-
81
-
82
-
83
-
84
-
85
-
86
-
87
-
88
-
89
-
90
-
91
-
92
-
93
-
94
-
95
-
96
-
97
-
98
-
99
-
100
-
101
-
102
-
103
-
104
-
105
-
106
-
107
-
108
-
109
-
110
-
111
-
112
-
113
-
114
-
115
-
116
-
117
-
118
-
119
-
120
-
121
-
122
-
123
-
124
-
125
-
126
-
127
-
128
-
129
-
130
-
131
-
132
-
133
-
134
-
135
-
136
-
137
-
138
-
139
-
140
 |
 |

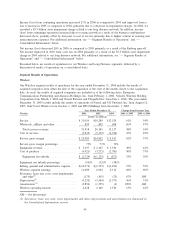
Selected Financial and Operating Data
The following is a summary of our subscriber activity and related subscriber metrics. The number of
subscribers impacts service revenues, cost of service and bad debt expense as well as support costs, such as
customer care, which are recorded in general and administrative expenses.
2006 2005 2004
For the Year Ended
December 31,
Direct subscribers, end of period (millions) .................................. 45.8
(1)
39.7 17.8
CDMA network .................................................... 24.2 20.5 17.8
iDEN network ..................................................... 21.6 19.2 N/A
Wholesale and affiliate subscribers, end of period (millions) ..................... 7.3 7.9 6.9
Direct net subscriber additions
(2)
(millions) .................................. 1.7 3.0 1.9
Monthly customer churn rate
Direct post-paid .................................................... 2.3% 2.2% 2.6%
Direct prepaid
(3)
.................................................... 6.2% 4.4% N/A
Weighted average ................................................... 2.6% 2.3% 2.6%
Average monthly service revenue per user
Direct post-paid .................................................... $61 $63 $62
Direct prepaid
(3)
.................................................... 33 37 N/A
Weighted average ................................................... 59 62 62
N/A — Not Applicable
(1) In the quarter ended December 31, 2006, we changed our subscriber deactivation process for post-paid
subscribers. To effect this change, the customer subscriber base as of October 1, 2006 was increased by
436,000 subscribers. This adjustment did not impact direct net subscriber additions or the monthly cus-
tomer churn rates for the quarter ended December 31, 2006. In addition, there were additional customer
subscriber base adjustments of 101,000 during the first three quarters of 2006.
(2) Direct net subscriber additions do not include subscribers acquired in connection with the Sprint-Nextel
merger or the PCS Affiliate or Nextel Partners acquisitions.
(3) The direct prepaid monthly customer churn rate and average monthly service revenue per user metrics in
2005 are calculated based only on results subsequent to the Sprint-Nextel merger.
Service Revenue
Service revenues consist of fixed monthly recurring charges, variable usage charges and miscellaneous fees
such as activation fees, directory assistance, operator-assisted calling, equipment protection, late payment
charges and certain regulatory related fees. Service revenues increased 61% in 2006 as compared to 2005
primarily due to the Sprint-Nextel merger and other acquisitions and the increase in the number of our direct
subscribers, partially offset by a decrease in our weighted average monthly service revenue per user to $59 in
2006 as compared to $62 in 2005. Service revenues increased 54% in 2005 as compared to 2004 primarily due
to the merger with Nextel and the increase in the number of our direct subscribers, while our weighted average
monthly service revenue per user remained flat year over year. In 2006, we ended the year with about
45.8 million direct subscribers and during the year had about 1.7 million net direct subscriber additions,
excluding the Nextel Partners and PCS Affiliate subscribers of about 4.1 million that were acquired with these
companies. In comparison, we ended 2005 with about 39.7 million direct subscribers and during the year had
about 3.0 million net direct subscriber additions excluding the Nextel and PCS Affiliate subscribers of about
18.9 million that were acquired with the merger or acquisition of these companies. In 2004, we ended the year
with about 17.8 million direct subscribers and had about 1.9 million net direct subscriber additions. We believe
that the growth in direct subscribers, separate from the growth attributable to subscribers gained as part of the
47