Sprint - Nextel 2006 Annual Report Download - page 33
Download and view the complete annual report
Please find page 33 of the 2006 Sprint - Nextel annual report below. You can navigate through the pages in the report by either clicking on the pages listed below, or by using the keyword search tool below to find specific information within the annual report.-
 1
1 -
2
-
3
-
4
-
5
-
6
-
7
-
8
-
9
-
10
-
11
-
12
-
13
-
14
-
15
-
16
-
17
-
18
-
19
-
20
-
21
-
22
-
 23
23 -
 24
24 -
 25
25 -
 26
26 -
 27
27 -
 28
28 -
 29
29 -
 30
30 -
 31
31 -
 32
32 -
 33
33 -
 34
34 -
 35
35 -
 36
36 -
 37
37 -
 38
38 -
 39
39 -
 40
40 -
 41
41 -
 42
42 -
 43
43 -
44
-
45
-
46
-
47
-
48
-
49
-
50
-
51
-
52
-
53
-
54
-
55
-
56
-
57
-
58
-
59
-
60
-
61
-
62
-
63
-
64
-
65
-
66
-
67
-
68
-
69
-
70
-
71
-
72
-
73
-
74
-
75
-
76
-
77
-
78
-
79
-
80
-
81
-
82
-
83
-
84
-
85
-
86
-
87
-
88
-
89
-
90
-
91
-
92
-
93
-
94
-
95
-
96
-
97
-
98
-
99
-
100
-
101
-
102
-
103
-
104
-
105
-
106
-
107
-
108
-
109
-
110
-
111
-
112
-
113
-
114
-
115
-
116
-
117
-
118
-
119
-
120
-
121
-
122
-
123
-
124
-
125
-
126
-
127
-
128
-
129
-
130
-
131
-
132
-
133
-
134
-
135
-
136
-
137
-
138
-
139
-
140
 |
 |

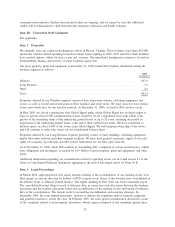
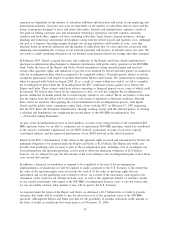
Performance Graph
The graph below compares the yearly percentage change in the cumulative total shareholder return for our
Series 1 common stock with the S&P»500 Stock Index and the Dow Jones U.S. Telecommunications Index
for the five-year period from December 31, 2001 to December 31, 2006. The cumulative total shareholder
return for our Series 1 common stock has been adjusted for the periods shown for the recombination of our
FON common stock and PCS common stock that was effected on April 23, 2004. The graph assumes an initial
investment of $100 in our common stock on December 31, 2001 and reinvestment of all dividends.
The Dow Jones U.S. Telecommunications Index is currently composed of the following companies: Alltel
Corp., AT&T Inc., CenturyTel Inc., Cincinnati Bell Inc., Citizens Communications Co., Dobson Communica-
tions Corp., Embarq, IDT Corp., Leap Wireless International Inc., Leucadia National Corp., Level 3 Commu-
nications Inc., NII Holdings Inc., Qwest Communications International Inc., RCN Corp., Sprint Nextel,
Telephone & Data Systems Inc., Time Warner Telecom, Inc., U.S. Cellular Corp., Verizon Communications
Inc., Virgin Media Inc. and Windstream Corp.
5-Year Total Return
0
20
40
60
80
100
120
140
160
180
200620052004200320022001
Dollars
Sprint Nextel
S&P 500
Dow Jones U.S. Telecom Index
Value of $100 Invested on December 31, 2001
2001 2002 2003 2004 2005 2006
Sprint Nextel ................ $100.00 $41.31 $ 49.65 $ 87.44 $ 83.13 $ 73.54
S&P500................... $100.00 $77.90 $100.25 $111.15 $116.61 $135.04
Dow Jones U.S. Telecom Index . . $100.00 $67.23 $ 75.76 $ 91.29 $ 93.16 $125.58
31