Starbucks 2012 Annual Report Download - page 31
Download and view the complete annual report
Please find page 31 of the 2012 Starbucks annual report below. You can navigate through the pages in the report by either clicking on the pages listed below, or by using the keyword search tool below to find specific information within the annual report.-
 1
1 -
2
-
3
-
4
-
5
-
6
-
7
-
8
-
9
-
10
-
11
-
12
-
13
-
14
-
15
-
16
-
17
-
18
-
19
-
20
-
 21
21 -
 22
22 -
 23
23 -
 24
24 -
 25
25 -
 26
26 -
 27
27 -
 28
28 -
 29
29 -
 30
30 -
 31
31 -
 32
32 -
 33
33 -
 34
34 -
 35
35 -
 36
36 -
 37
37 -
 38
38 -
 39
39 -
 40
40 -
 41
41 -
42
-
43
-
44
-
45
-
46
-
47
-
48
-
49
-
50
-
51
-
52
-
53
-
54
-
55
-
56
-
57
-
58
-
59
-
60
-
61
-
62
-
63
-
64
-
65
-
66
-
67
-
68
-
69
-
70
-
71
-
72
-
73
-
74
-
75
-
76
-
77
-
78
-
79
-
80
-
81
-
82
-
83
-
84
-
85
-
86
-
87
-
88
-
89
-
90
-
91
-
92
-
93
-
94
-
95
-
96
-
97
-
98
-
99
-
100
-
101
-
102
-
103
-
104
-
105
-
106
-
107
-
108
-
109
-
110
 |
 |
25
Item 7. Management’s Discussion and Analysis of Financial Condition and Results of Operations
General
Our fiscal year ends on the Sunday closest to September 30. The fiscal year ended on October 3, 2010 included 53
weeks with the 53rd week falling in the fourth fiscal quarter. The fiscal years ended on October 2, 2011 and
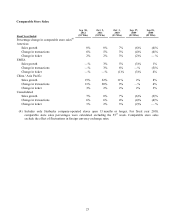
September 30, 2012 both included 52 weeks. Comparable store sales percentages for fiscal 2010 are calculated
excluding the 53rd week. All references to store counts, including data for new store openings, are reported net of
related store closures, unless otherwise noted.
Financial Highlights
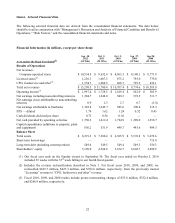
• Total net revenues increased 14% to $13.3 billion in fiscal 2012 compared to $11.7 billion in fiscal 2011.
The increase was due primarily to a 7% increase in global comparable store sales, 50% revenue growth in
Channel Development, and 20% growth in licensed stores revenue. The comparable store sales growth in
company-operated stores was comprised of a 6% increase in the number of transactions and a 1% increase
in average ticket.
• Consolidated operating income was $2.0 billion in fiscal 2012 compared to $1.7 billion in fiscal 2011 and
operating margin increased to 15.0% compared to 14.8% in fiscal 2011. The operating margin expansion
was driven by increased sales leverage and the absence of charges in fiscal 2012 related to the Seattle's
Best Coffee store closures in Border's bookstores, partially offset by higher commodity costs.
• EPS for fiscal 2012 was $1.79, compared to EPS of $1.62 reported in fiscal 2011, with the increase driven
by the improved sales leverage, partially offset by the impact of higher commodity costs in fiscal 2012 and
certain gains recorded in the fourth quarter of fiscal 2011, including a gain from a fair market value
adjustment resulting from the acquisition of the remaining ownership interest in our joint venture in
Switzerland and Austria as well as a gain on the sale of corporate real estate.
• Cash flow from operations was $1.8 billion in fiscal 2012 compared to $1.6 billion in fiscal 2011. Capital
expenditures were approximately $856 million in fiscal 2012 compared to $532 million in fiscal 2011.
Available operating cash flow after capital expenditures during fiscal 2012 was directed at returning
approximately $1.1 billion of cash to our shareholders via share repurchases and dividends.
Overview
Starbucks results for fiscal 2012 reflect the strength of our global business model. We continue to execute on our
new regional operating model which we implemented at the beginning of fiscal 2012. We now have four
reportable operating segments: Americas; Europe, Middle East, and Africa ("EMEA"); China / Asia Pacific
("CAP") and Channel Development. Each segment is managed by an operating segment president.
Total net revenues increased 14% to $13.3 billion driven by global comparable store sales growth of 7% and a
50% increase in Channel Development revenue. This growth drove increased sales leverage and resulted in higher
operating margin and net earnings compared to fiscal 2011. This helped mitigate the impact of higher commodity
costs, mostly coffee, which negatively impacted operating income by approximately $214 million for the year,
equivalent to approximately 160 basis points of impact on operating margin.
Our Americas business continued its strong momentum and contributed 75% of total net revenues in fiscal 2012.
The revenue growth for the year was driven by an 8% increase in comparable store sales, comprised of a 6%
increase in traffic and a 2% increase in average ticket. This sales growth, combined with a continued focus on
operational efficiencies, drove increased sales leverage that offset the impact of higher commodity costs. Looking
forward, we expect to continue driving sales growth and profitability through continued store efficiency efforts,
new store development, and expanding our pipeline of new product offerings to increase revenues throughout all
dayparts.