Starbucks 2012 Annual Report Download - page 56
Download and view the complete annual report
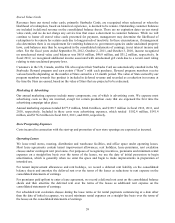
Please find page 56 of the 2012 Starbucks annual report below. You can navigate through the pages in the report by either clicking on the pages listed below, or by using the keyword search tool below to find specific information within the annual report.-
 1
1 -
2
-
3
-
4
-
5
-
6
-
7
-
8
-
9
-
10
-
11
-
12
-
13
-
14
-
15
-
16
-
17
-
18
-
19
-
20
-
21
-
22
-
23
-
24
-
25
-
26
-
27
-
28
-
29
-
30
-
31
-
32
-
33
-
34
-
35
-
36
-
37
-
38
-
39
-
40
-
41
-
42
-
43
-
44
-
45
-
 46
46 -
 47
47 -
 48
48 -
 49
49 -
 50
50 -
 51
51 -
 52
52 -
 53
53 -
 54
54 -
 55
55 -
 56
56 -
 57
57 -
 58
58 -
 59
59 -
 60
60 -
 61
61 -
 62
62 -
 63
63 -
 64
64 -
 65
65 -
 66
66 -
67
-
68
-
69
-
70
-
71
-
72
-
73
-
74
-
75
-
76
-
77
-
78
-
79
-
80
-
81
-
82
-
83
-
84
-
85
-
86
-
87
-
88
-
89
-
90
-
91
-
92
-
93
-
94
-
95
-
96
-
97
-
98
-
99
-
100
-
101
-
102
-
103
-
104
-
105
-
106
-
107
-
108
-
109
-
110
 |
 |

50
Item 8. Financial Statements and Supplementary Data
STARBUCKS CORPORATION
CONSOLIDATED STATEMENTS OF EARNINGS
(in millions, except per share data)
Fiscal Year Ended
Sep 30,
2012
Oct 2,
2011
Oct 3,
2010
Net revenues:
Company-operated stores $ 10,534.5 $ 9,632.4 $ 8,963.5
Licensed stores 1,210.3 1,007.5 875.2
CPG, foodservice and other 1,554.7 1,060.5 868.7
Total net revenues 13,299.5 11,700.4 10,707.4
Cost of sales including occupancy costs 5,813.3 4,915.5 4,416.5
Store operating expenses 3,918.1 3,594.9 3,471.9
Other operating expenses 429.9 392.8 279.7
Depreciation and amortization expenses 550.3 523.3 510.4
General and administrative expenses 801.2 749.3 704.6
Restructuring charges —
—
53.0
Total operating expenses 11,512.8 10,175.8 9,436.1
Gain on sale of properties — 30.2
—
Income from equity investees 210.7 173.7 148.1
Operating income 1,997.4 1,728.5 1,419.4
Interest income and other, net 94.4 115.9 50.3
Interest expense (32.7) (33.3) (32.7)
Earnings before income taxes 2,059.1 1,811.1 1,437.0
Income taxes 674.4 563.1 488.7
Net earnings including noncontrolling interests 1,384.7 1,248.0 948.3
Net earnings (loss) attributable to noncontrolling
interests 0.9 2.3 2.7
Net earnings attributable to Starbucks $ 1,383.8 $ 1,245.7 $ 945.6
Earnings per share — basic $ 1.83 $ 1.66 $ 1.27
Earnings per share — diluted $ 1.79 $ 1.62 $ 1.24
Weighted average shares outstanding:
Basic 754.4 748.3 744.4
Diluted 773.0 769.7 764.2
Cash dividends declared per share $ 0.72 $ 0.56 $ 0.36
See Notes to Consolidated Financial Statements.