Starbucks 2012 Annual Report Download - page 35
Download and view the complete annual report
Please find page 35 of the 2012 Starbucks annual report below. You can navigate through the pages in the report by either clicking on the pages listed below, or by using the keyword search tool below to find specific information within the annual report.-
 1
1 -
2
-
3
-
4
-
5
-
6
-
7
-
8
-
9
-
10
-
11
-
12
-
13
-
14
-
15
-
16
-
17
-
18
-
19
-
20
-
21
-
22
-
23
-
24
-
 25
25 -
 26
26 -
 27
27 -
 28
28 -
 29
29 -
 30
30 -
 31
31 -
 32
32 -
 33
33 -
 34
34 -
 35
35 -
 36
36 -
 37
37 -
 38
38 -
 39
39 -
 40
40 -
 41
41 -
 42
42 -
 43
43 -
 44
44 -
 45
45 -
46
-
47
-
48
-
49
-
50
-
51
-
52
-
53
-
54
-
55
-
56
-
57
-
58
-
59
-
60
-
61
-
62
-
63
-
64
-
65
-
66
-
67
-
68
-
69
-
70
-
71
-
72
-
73
-
74
-
75
-
76
-
77
-
78
-
79
-
80
-
81
-
82
-
83
-
84
-
85
-
86
-
87
-
88
-
89
-
90
-
91
-
92
-
93
-
94
-
95
-
96
-
97
-
98
-
99
-
100
-
101
-
102
-
103
-
104
-
105
-
106
-
107
-
108
-
109
-
110
 |
 |

29
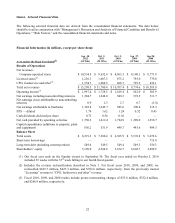
Other Income and Expenses
Fiscal Year Ended
Sep 30,
2012
Oct 2,
2011
Sep 30,
2012
Oct 2,
2011
% of Total
Net Revenues
Operating income $ 1,997.4 $ 1,728.5 15.0% 14.8%
Interest income and other, net 94.4 115.9 0.7% 1.0%
Interest expense (32.7) (33.3) (0.2)% (0.3)%
Earnings before income taxes 2,059.1 1,811.1 15.5% 15.5%
Income taxes 674.4 563.1 5.1% 4.8%
Net earnings including noncontrolling interests 1,384.7 1,248.0 10.4% 10.7%
Net earnings (loss) attributable to noncontrolling
interests 0.9 2.3
—
—
Net earnings attributable to Starbucks $ 1,383.8 $ 1,245.7 10.4% 10.6%
Effective tax rate including noncontrolling interests 32.8% 31.1%
Net interest income and other decreased $21 million over the prior year, primarily due to the absence of the gain
recognized in the fourth quarter of fiscal 2011 resulting from the acquisition of the remaining interest in our
previous joint venture operations in Switzerland and Austria (approximately $55 million), partially offset by the
recognition of additional income associated with unredeemed gifts cards in the second quarter of fiscal 2012
(approximately $29 million), following a court ruling related to state unclaimed property laws.
Income taxes for the fiscal year ended 2012 resulted in an effective tax rate of 32.8% compared to 31.1% for fiscal
year 2011. The rate increased in fiscal year 2012 primarily due to tax benefits recognized in fiscal 2011 from the
Switzerland and Austria transaction and the release of foreign valuation allowances. The effective tax rate for
fiscal 2013 is expected to be approximately 33%.
% %