Starbucks 2012 Annual Report Download - page 33
Download and view the complete annual report
Please find page 33 of the 2012 Starbucks annual report below. You can navigate through the pages in the report by either clicking on the pages listed below, or by using the keyword search tool below to find specific information within the annual report.-
 1
1 -
2
-
3
-
4
-
5
-
6
-
7
-
8
-
9
-
10
-
11
-
12
-
13
-
14
-
15
-
16
-
17
-
18
-
19
-
20
-
21
-
22
-
 23
23 -
 24
24 -
 25
25 -
 26
26 -
 27
27 -
 28
28 -
 29
29 -
 30
30 -
 31
31 -
 32
32 -
 33
33 -
 34
34 -
 35
35 -
 36
36 -
 37
37 -
 38
38 -
 39
39 -
 40
40 -
 41
41 -
 42
42 -
 43
43 -
44
-
45
-
46
-
47
-
48
-
49
-
50
-
51
-
52
-
53
-
54
-
55
-
56
-
57
-
58
-
59
-
60
-
61
-
62
-
63
-
64
-
65
-
66
-
67
-
68
-
69
-
70
-
71
-
72
-
73
-
74
-
75
-
76
-
77
-
78
-
79
-
80
-
81
-
82
-
83
-
84
-
85
-
86
-
87
-
88
-
89
-
90
-
91
-
92
-
93
-
94
-
95
-
96
-
97
-
98
-
99
-
100
-
101
-
102
-
103
-
104
-
105
-
106
-
107
-
108
-
109
-
110
 |
 |

27
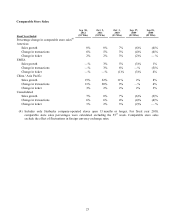
Starbucks store base in EMEA and CAP continues to expand and we continue to focus on achieving sustainable
growth from established international markets while at the same time investing in emerging markets, such as
China. Occupancy costs and store operating expenses can be higher in certain international markets than in the
Americas segment due to higher rents for prime store locations or costs of compliance with country-specific
regulatory requirements. Because many of our international operations are in an early phase of development,
operating expenses as a percentage of related revenues are often higher compared to the Americas segment.
International markets in the early stages of development require a more extensive support organization, relative to
the current levels of revenue and operating income, than the Americas.
The Channel Development segment includes packaged coffee and tea, a variety of ready-to-drink beverages,
single-serve coffee and tea products and other branded product operations worldwide, as well as the US
foodservice business. In prior years through the first several months of fiscal 2011, we sold a selection of
Starbucks and Seattle’s Best Coffee branded packaged coffees and Tazo®teas in grocery and warehouse club
stores throughout the US and to grocery stores in Canada, the UK and other European countries through a
distribution arrangement with Kraft Foods Global, Inc. Kraft managed the distribution, marketing, advertising and
promotion of these products as a part of that arrangement. During fiscal 2011, we successfully transitioned these
businesses including the marketing, advertising, and promotion of these products, from our previous distribution
arrangement with Kraft and began selling these products directly to the grocery and warehouse club stores. Our
Channel Development segment also includes ready-to-drink beverages, which are primarily manufactured and
distributed through The North American Coffee Partnership, a joint venture with the Pepsi-Cola Company. The
proportionate share of the results of the joint venture is included, on a net basis, in income from equity investees
on the consolidated statements of earnings. The US foodservice business sells coffee and other related products to
institutional foodservice companies with the majority of its sales through national broad-line distribution
networks. The Channel Development segment reflects a modest cost structure and a resulting higher operating
margin, compared to the other reporting segments, which consist primarily of retail stores.
Acquisitions
See Note 2 to the consolidated financial statements in this 10-K.
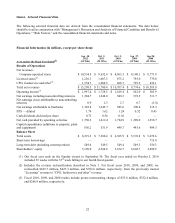
RESULTS OF OPERATIONS — FISCAL 2012 COMPARED TO FISCAL 2011
Consolidated results of operations (in millions):
Revenues
Fiscal Year Ended
Sep 30,
2012
Oct 2,
2011
%
Change
Sep 30,
2012
Oct 2,
2011
% of Total
Net Revenues
Net revenues:
Company-operated stores $ 10,534.5 $ 9,632.4 9.4% 79.2% 82.3%
Licensed stores 1,210.3 1,007.5 20.1% 9.1% 8.6%
CPG, foodservice and other 1,554.7 1,060.5 46.6% 11.7% 9.1%
Total net revenues $ 13,299.5 $ 11,700.4 13.7% 100.0% 100.0%
Consolidated net revenues were $13.3 billion for fiscal 2012, an increase of 13.7%, or $1.6 billion over fiscal
2011, primarily due to increased revenues from company-operated stores (contributing $902 million), driven by an
increase in comparable store sales (approximately 7%, or $680 million). Also contributing to the increase were