Starbucks 2012 Annual Report Download - page 59
Download and view the complete annual report
Please find page 59 of the 2012 Starbucks annual report below. You can navigate through the pages in the report by either clicking on the pages listed below, or by using the keyword search tool below to find specific information within the annual report.-
 1
1 -
2
-
3
-
4
-
5
-
6
-
7
-
8
-
9
-
10
-
11
-
12
-
13
-
14
-
15
-
16
-
17
-
18
-
19
-
20
-
21
-
22
-
23
-
24
-
25
-
26
-
27
-
28
-
29
-
30
-
31
-
32
-
33
-
34
-
35
-
36
-
37
-
38
-
39
-
40
-
41
-
42
-
43
-
44
-
45
-
46
-
47
-
48
-
 49
49 -
 50
50 -
 51
51 -
 52
52 -
 53
53 -
 54
54 -
 55
55 -
 56
56 -
 57
57 -
 58
58 -
 59
59 -
 60
60 -
 61
61 -
 62
62 -
 63
63 -
 64
64 -
 65
65 -
 66
66 -
 67
67 -
 68
68 -
 69
69 -
70
-
71
-
72
-
73
-
74
-
75
-
76
-
77
-
78
-
79
-
80
-
81
-
82
-
83
-
84
-
85
-
86
-
87
-
88
-
89
-
90
-
91
-
92
-
93
-
94
-
95
-
96
-
97
-
98
-
99
-
100
-
101
-
102
-
103
-
104
-
105
-
106
-
107
-
108
-
109
-
110
 |
 |

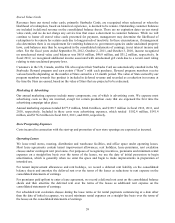
STARBUCKS CORPORATION
CONSOLIDATED STATEMENTS OF EQUITY
(in millions)
Common Stock
Additional
Paid-in
Capital
Retained
Earnings
Accumulated
Other
Comprehensive
Income/(Loss)
Shareholders’
Equity
Noncontrolling
Interest Total
Shares Amount
Balance, September 27, 2009 742.9 $0.7
$ 186.4 $ 2,793.2 $ 65.4 $ 3,045.7 $ 11.2 $ 3,056.9
Net earnings
—
—
—
945.6
—
945.6 2.7 948.3
Unrealized holding loss, net
—
—
—
—
(17.0) (17.0)
—
(17.0 )
Translation adjustment, net of tax
—
—
—
—
8.8 8.8
—
8.8
Comprehensive income 937.4 2.7 940.1
Stock-based compensation expense
—
—
115.6
—
—
115.6
—
115.6
Exercise of stock options, including tax benefit of $27.7 10.1
—
137.5
—
—
137.5
—
137.5
Sale of common stock, including tax benefit of $0.1 0.8
—
18.5
—
—
18.5
—
18.5
Repurchase of common stock (11.2)
—
(285.6 )
—
—
(285.6)
—
(285.6 )
Net distributions to noncontrolling interests
—
—
—
—
—
—
(0.8) (0.8 )
Cash dividend
—
—
—
(267.6)
—
(267.6)
—
(267.6 )
Purchase of noncontrolling interests
—
—
(26.8 )
—
—
(26.8) (5.5) (32.3 )
Balance, October 3, 2010 742.6 $0.7
$ 145.6 $ 3,471.2 $ 57.2 $ 3,674.7 $7.6
$ 3,682.3
Net earnings
—
—
—
1,245.7
—
1,245.7 2.3 1,248.0
Unrealized holding loss, net
—
—
—
—
(4.4) (4.4)
—
(4.4 )
Translation adjustment, net of tax
—
—
—
—
(6.5) (6.5)
—
(6.5 )
Comprehensive income 1,234.8 2.3 1,237.1
Stock-based compensation expense
—
—
147.2
—
—
147.2
—
147.2
Exercise of stock options, including tax benefit of $96.1 17.3
—
312.5
—
—
312.5
—
312.5
Sale of common stock, including tax benefit of $0.1 0.5
—
19.1
—
—
19.1
—
19.1
Repurchase of common stock (15.6)
—
(555.9 )
—
—
(555.9)
—
(555.9 )
Cash dividend
—
—
—
(419.5)
—
(419.5)
—
(419.5 )
Purchase of noncontrolling interests
—
—
(28.0 )
—
—
(28.0) (7.5) (35.5 )
Balance, October 2, 2011 744.8 $0.7
$ 40.5 $ 4,297.4 $ 46.3 $ 4,384.9 $2.4
$ 4,387.3
Net earnings
—
—
—
1,383.8
—
1,383.8 0.9 1,384.7
Unrealized holding loss, net
—
—
—
—
(26.4) (26.4)
—
(26.4 )
Translation adjustment, net of tax
—
—
—
—
2.8 2.8
—
2.8
Comprehensive income 1,360.2 0.9 1,361.1
Stock-based compensation expense
—
—
155.2
—
—
155.2
—
155.2
Exercise of stock options, including tax benefit of $167.3 16.5
—
326.1
—
—
326.1
—
326.1
Sale of common stock, including tax benefit of $0.2 0.3
—
19.5
—
—
19.5
—
19.5
Repurchase of common stock (12.3)
—
(501.9 ) (91.3)
—
(593.2)
—
(593.2 )
Cash dividend
—
—
—
(543.7)
—
(543.7)
—
(543.7 )
Non-controlling interest resulting from acquisition
—
—
—
—
—
—
2.2 2.2
Balance, September 30, 2012 749.3 $0.7
$ 39.4 $ 5,046.2 $ 22.7 $ 5,109.0 $5.5
$ 5,114.5
See Notes to Consolidated Financial Statements.
53