Starbucks 2012 Annual Report Download - page 8
Download and view the complete annual report
Please find page 8 of the 2012 Starbucks annual report below. You can navigate through the pages in the report by either clicking on the pages listed below, or by using the keyword search tool below to find specific information within the annual report.-
 1
1 -
 2
2 -
 3
3 -
 4
4 -
 5
5 -
 6
6 -
 7
7 -
 8
8 -
 9
9 -
 10
10 -
 11
11 -
 12
12 -
 13
13 -
 14
14 -
 15
15 -
 16
16 -
 17
17 -
 18
18 -
 19
19 -
20
-
21
-
22
-
23
-
24
-
25
-
26
-
27
-
28
-
29
-
30
-
31
-
32
-
33
-
34
-
35
-
36
-
37
-
38
-
39
-
40
-
41
-
42
-
43
-
44
-
45
-
46
-
47
-
48
-
49
-
50
-
51
-
52
-
53
-
54
-
55
-
56
-
57
-
58
-
59
-
60
-
61
-
62
-
63
-
64
-
65
-
66
-
67
-
68
-
69
-
70
-
71
-
72
-
73
-
74
-
75
-
76
-
77
-
78
-
79
-
80
-
81
-
82
-
83
-
84
-
85
-
86
-
87
-
88
-
89
-
90
-
91
-
92
-
93
-
94
-
95
-
96
-
97
-
98
-
99
-
100
-
101
-
102
-
103
-
104
-
105
-
106
-
107
-
108
-
109
-
110
 |
 |
2
PART I
Item 1. Business
General
Starbucks is the premier roaster, marketer and retailer of specialty coffee in the world, operating in 60 countries.
Formed in 1985, Starbucks Corporation’s common stock trades on the NASDAQ Global Select Market
(“NASDAQ”) under the symbol “SBUX.” We purchase and roast high-quality coffees that we sell, along with
handcrafted coffee, tea and other beverages and a variety of fresh food items, through company-operated stores.
We also sell a variety of coffee and tea products and license our trademarks through other channels such as
licensed stores, grocery and national foodservice accounts. In addition to our flagship Starbucks brand, our
portfolio also includes Tazo®Tea, Seattle’s Best Coffee®, Starbucks VIA®Ready Brew, Starbucks Refreshers™
beverages, Evolution Fresh™, La Boulange bakery brand and the Verismo™ System by Starbucks.
Our objective is to maintain Starbucks standing as one of the most recognized and respected brands in the world.
To achieve this goal, we are continuing the disciplined expansion of our global store base. In addition, by
leveraging the experience gained through our traditional store model, we continue to offer consumers new coffee
products in a variety of forms, across new categories, and through diverse channels. Starbucks Global
Responsibility strategy and commitments related to coffee and the communities we do business in, as well as our
focus on being an employer of choice, are also key complements to our business strategies.
In this Annual Report on Form 10-K (“10-K” or “Report”) for the fiscal year ended September 30, 2012 (“fiscal
2012”), Starbucks Corporation (together with its subsidiaries) is referred to as “Starbucks,” the “Company,”
“we,” “us” or “our.”
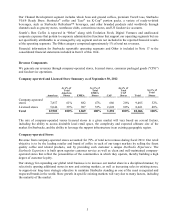
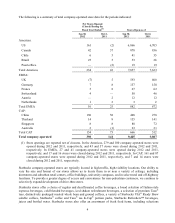
Segment Financial Information
Segment information is prepared on the same basis that our management reviews financial information for
operational decision-making purposes. Beginning with the first quarter of fiscal 2012, we redefined our
reportable operating segments to align with the three-region leadership and organizational structure of our retail
business that took effect at the beginning of fiscal 2012.
The three-region structure includes: 1) Americas, inclusive of the US, Canada, and Latin America; 2) Europe,
Middle East, and Africa, collectively referred to as the “EMEA” region; and 3) China / Asia Pacific (“CAP”).
Our chief executive officer, who is our chief operating decision maker, manages these businesses, evaluates
financial results, and makes key operating decisions based on the new organizational structure. Accordingly,
beginning with the first quarter of fiscal 2012, we revised our reportable operating segments from 1) US, 2)
International, and 3) Global Consumer Products Group to the following four reportable segments: 1) Americas,
2) EMEA, 3) CAP, and 4) Global Consumer Products Group. In the second quarter of fiscal 2012, we renamed
our Global Consumer Products Group segment “Channel Development.” Segment revenues as a percentage of
total net revenues for fiscal year 2012 were as follows: Americas (75%), EMEA (9%), CAP (5%), and Channel
Development (10%).
Concurrent with the change in reportable operating segments, we revised our prior period financial information
to reflect comparable financial information for the new segment structure. Historical financial information
presented herein reflects this change.
The Americas, EMEA, and CAP segments include both company-operated and licensed stores. Our Americas
segment is our most mature business and has achieved significant scale. Certain markets within EMEA and CAP
operations are in the early stages of development and require a more extensive support organization, relative to
the current levels of revenue and operating income, than the Americas operations. The Americas and EMEA
segments also include foodservice accounts, primarily in Canada and the UK. Our Americas segment also
includes the retail and wholesale activities of Bay Bread, LLC (doing business as La Boulange), which was
acquired in the fourth quarter of fiscal 2012.